

Today, the winner in manufacturing is not the one with more machines or a larger workforce. The winner is the one who can maximize the use of the resources already available. And that’s exactly the essence of the OEE – Overall Equipment Effectiveness indicator. It’s one of the most important tools for managing production performance, capable of uncovering where a company’s hidden potential lies. More importantly, it enables this potential to be converted into tangible results.
What Is OEE and What Does It Measure?
OEE is a quantitative indicator of a machine’s overall effectiveness. It measures how efficiently a machine actually operates compared to its full potential, by considering three critically important components: availability, performance, and quality.
- Availability shows how much time the machine was actually producing compared to how much time it was scheduled to produce.
- Performance indicates whether the machine produced the expected number of units in the actual production time, based on the ideal cycle time.
- Quality measures the ratio of defect-free products to total output.
Each of these dimensions is expressed as a percentage, and the final OEE value is the product of these three percentages. In practice, this means that even if each individual component is relatively high, the combined effect may still reveal significant losses.
Example:
If a machine had 100% availability (ran for the full 8 hours) and 100% performance (produced the expected number of pieces), but only 50% of the products met quality standards, the resulting OEE would be just 50%.
Because 100% x 100% x 50% = 50%
OEE is also commonly used as a core metric in methodologies such as Downtime Management, Lean Manufacturing, Six Sigma, or Kaizen.
What Does the Final OEE Value Really Tell Us?
OEE acts like a diagnostic tool, similar to a thermometer. It won’t fix the problem by itself but helps identify it. The final OEE value is above all an indicator of where the company has room for improvement.
- If availability is low, it’s time to analyze downtime.
- If performance is poor, focus on optimizing production cycles.
- If quality is lacking, investigate causes of defects.
Many companies assume they’re running at 90–100%, simply because production appears to be moving. But this subjective perception often hides a harsher reality. Real-world data often reveals that OEE is around 50–60%. In some cases, it’s as low as 45%, meaning more than half of the machine’s potential goes unused.
On the other hand, the “World Class” level of OEE is around 85%, which is already exceptional in many sectors. And the gap between these two levels represents a huge improvement opportunity.
It’s easy to “create” perfect numbers – by setting low production targets or ignoring true cycle times. When data is collected manually, it’s not unusual to see inflated values like 97–98%, which reflect a convenient plan, not actual performance.
Sometimes, with a poorly defined goal and only 50% availability, a company can “achieve” an OEE of over 130%. This is obviously methodologically incorrect.
Only if the cycle times reflect the real mechanical capabilities of the equipment and data collection is accurate, can OEE be a reliable indicator.
What Comes After Measuring OEE?
With a well-configured data collection system, the application itself can identify most of the specific reasons for reduced efficiency:
- Why is the machine not running?
- How many minutes per day are lost to short stoppages?
- How often does material run out?
- Which breakdowns occur most frequently?
All of this can be monitored in real-time and easily evaluated using clear reports. These reports reveal where the biggest losses occur – whether in terms of time or costs – and give management a solid basis for corrective actions.
Just like with IoT solutions, the goal isn’t to collect data. The goal is to act on it. That’s why we use the Six Big Losses model.
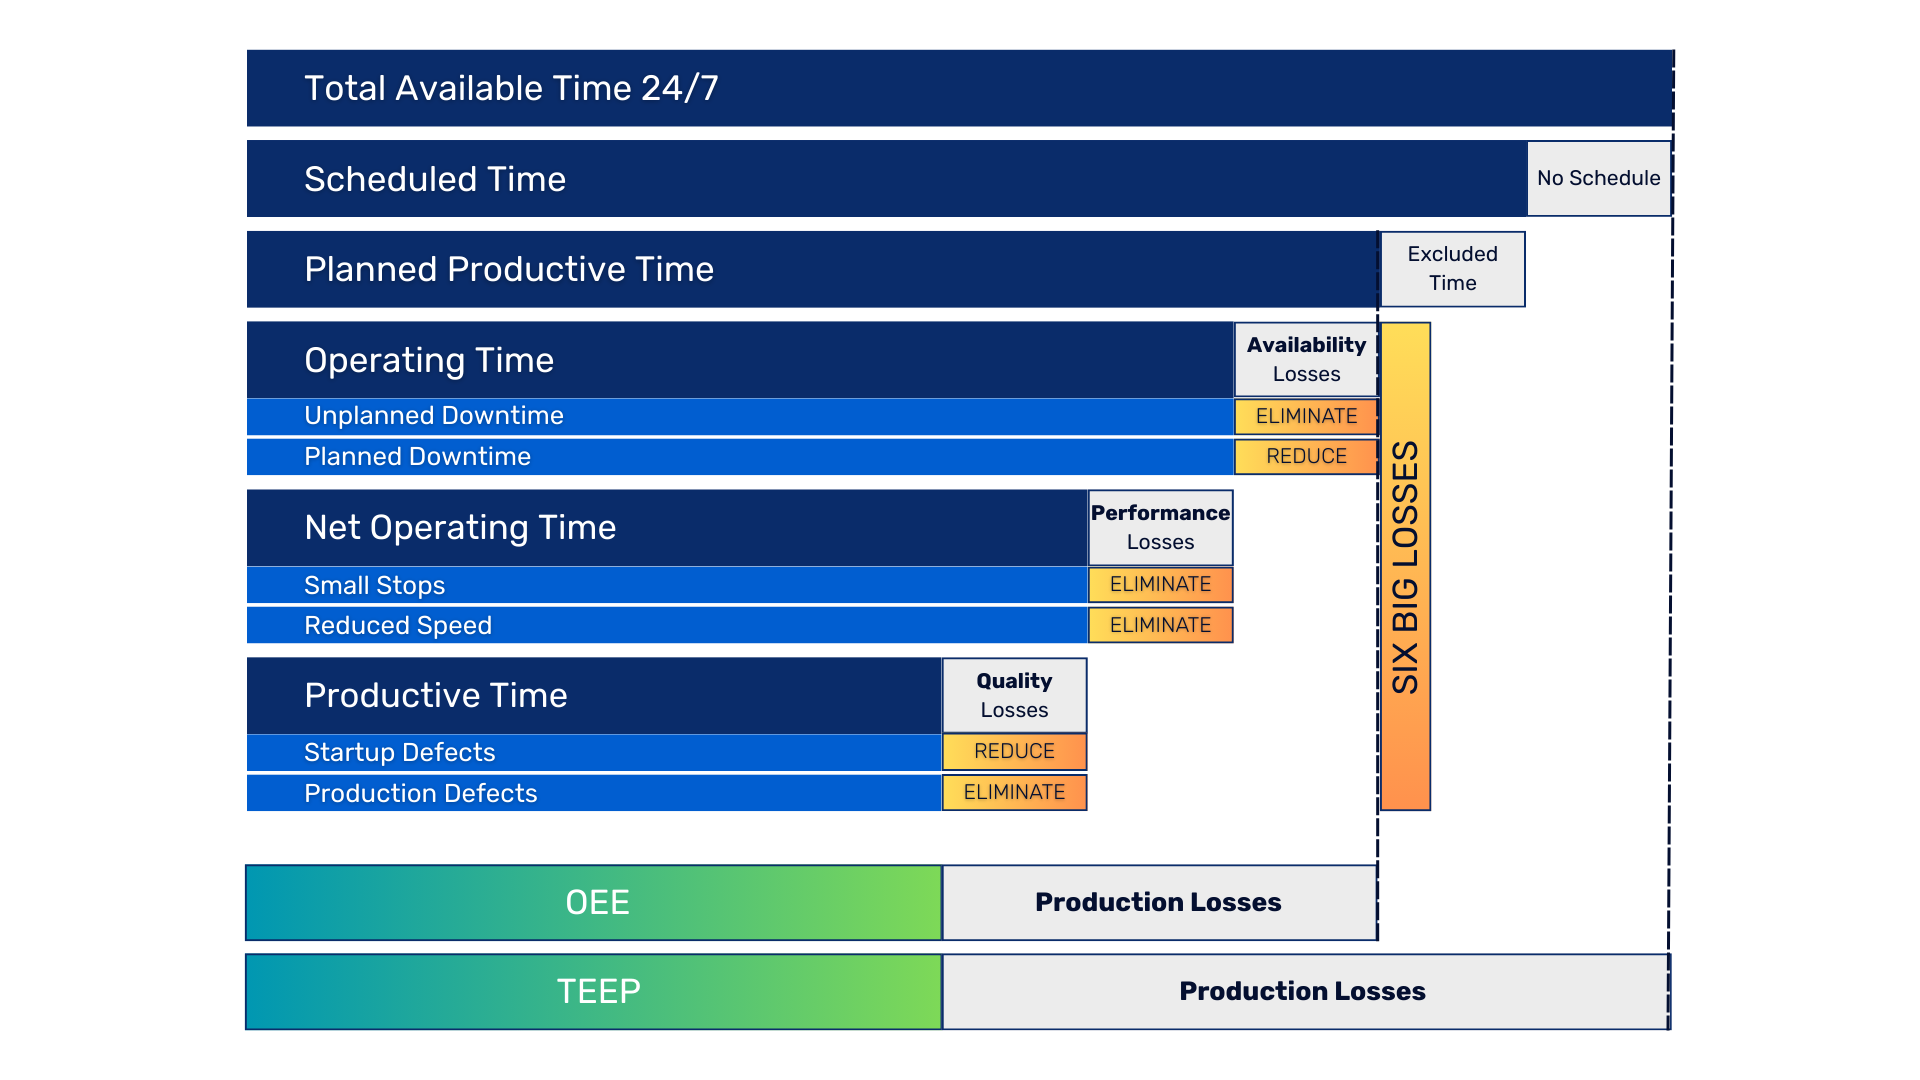
The Six Big Losses Model
This model categorizes losses into three groups, each linked to one of the three OEE components:
- Availability Losses
- Unplanned Downtime: machine failures, missing materials, unexpected maintenance
- Planned Downtime: changeovers, scheduled maintenance, cleaning
- Performance Losses
- Short Stops: brief downtimes typically under one minute
- Reduced Speed: when a machine runs slower than its optimal rate
- Quality Losses
- Startup Defects: errors during machine warm-up
- Production Defects: non-conforming products during normal operation
What makes this model powerful is not just naming the six major loss types, but also assigning a specific goal for their elimination.
- Some losses (e.g., unplanned downtime, short stops, speed losses, process defects) can and should be eliminated entirely.
- Others (like changeovers or startup errors) can at least be minimized.
This structure helps businesses not only define problems but also set realistic and measurable goals – resulting in a much more systematic improvement process.
OEE as a Practical Tool, Not Just a Metric
One of the biggest strengths of OEE is its ability to challenge gut feelings with facts. It replaces assumptions with data, emotions with numbers, and “we think we’re efficient” with measurable reality. It exposes hidden machine capacity, which often remains unused simply because no one is tracking it.
With OEE, performance becomes something that can be measured, managed, and improved. It’s not just a metric – it’s a transformational tool.
✅ OEE Increases by 10–15% Right After Implementation
Simply starting to measure – without any other changes – often leads to a dramatic shift in behavior. It boosts discipline, reduces unnecessary downtime, and makes time usage more efficient. This “halo effect” typically results in an immediate OEE boost of 10 to 15%.
Not because the technology changed – but because awareness did.
✅ A Key Milestone on the Road to Digital Transformation
OEE is also an essential step toward digitalizing production.
It replaces paper forms, messy spreadsheets, and imprecise guesses with automated data collection, instantly available real-time reports, and a whole new level of management insight.
Companies that adopt OEE gain continuous visibility into performance – at the level of specific machines, lines, and operations.
✅ Immediate Response to Any Issue
With OEE, data is no longer a historical snapshot – it becomes a daily decision-making tool.
If management sees that a machine loses an hour each shift due to lack of materials, they can act. Maybe the issue is delayed warehouse communication. By adding a simple feature – such as an automatic alert when material drops below 10% – the downtime can be reduced from 60 minutes to just 5.
Not next week. Not after a meeting. But the next day. That’s the power of real-time data.
✅ A Continuous Optimization Process
OEE isn’t just analysis – it’s action.
Everyone from operators to managers has live access to what’s really happening. They know what changed, what worked, and what needs further adjustment. This transforms improvement from a one-off project to a continuous optimization process, built not on guesses, but on data.
✅ Savings of Tens or Hundreds of Thousands of Euros, ROI Within Months
Perhaps most importantly, OEE increases output without needing new machines.
A 25% OEE improvement across 20 machines can achieve the same output gain as buying five new machines, saving tens to hundreds of thousands of euros.
Thanks to the flexible licensing of Ignition software, the return on investment in OEE is often just a few months to a year. And from that point on, the system pays for itself.