PLC ako základ pre meranie efektivity zariadení (OEE) | Realita z praxe, ktorú v škole neuvidíte | PLC as the Foundation for Measuring Equipment Efficiency (OEE) | Real-World Insights You Won’t Learn at School

PLC as the Foundation for Measuring Equipment Effectiveness (OEE) | Real-World Practice You Will Not See at School

If you study electrical engineering, automation, or computer science, you probably encounter diagrams, algorithms, and control logic on a daily basis. The question, however, is whether you know how these things work in real manufacturing.

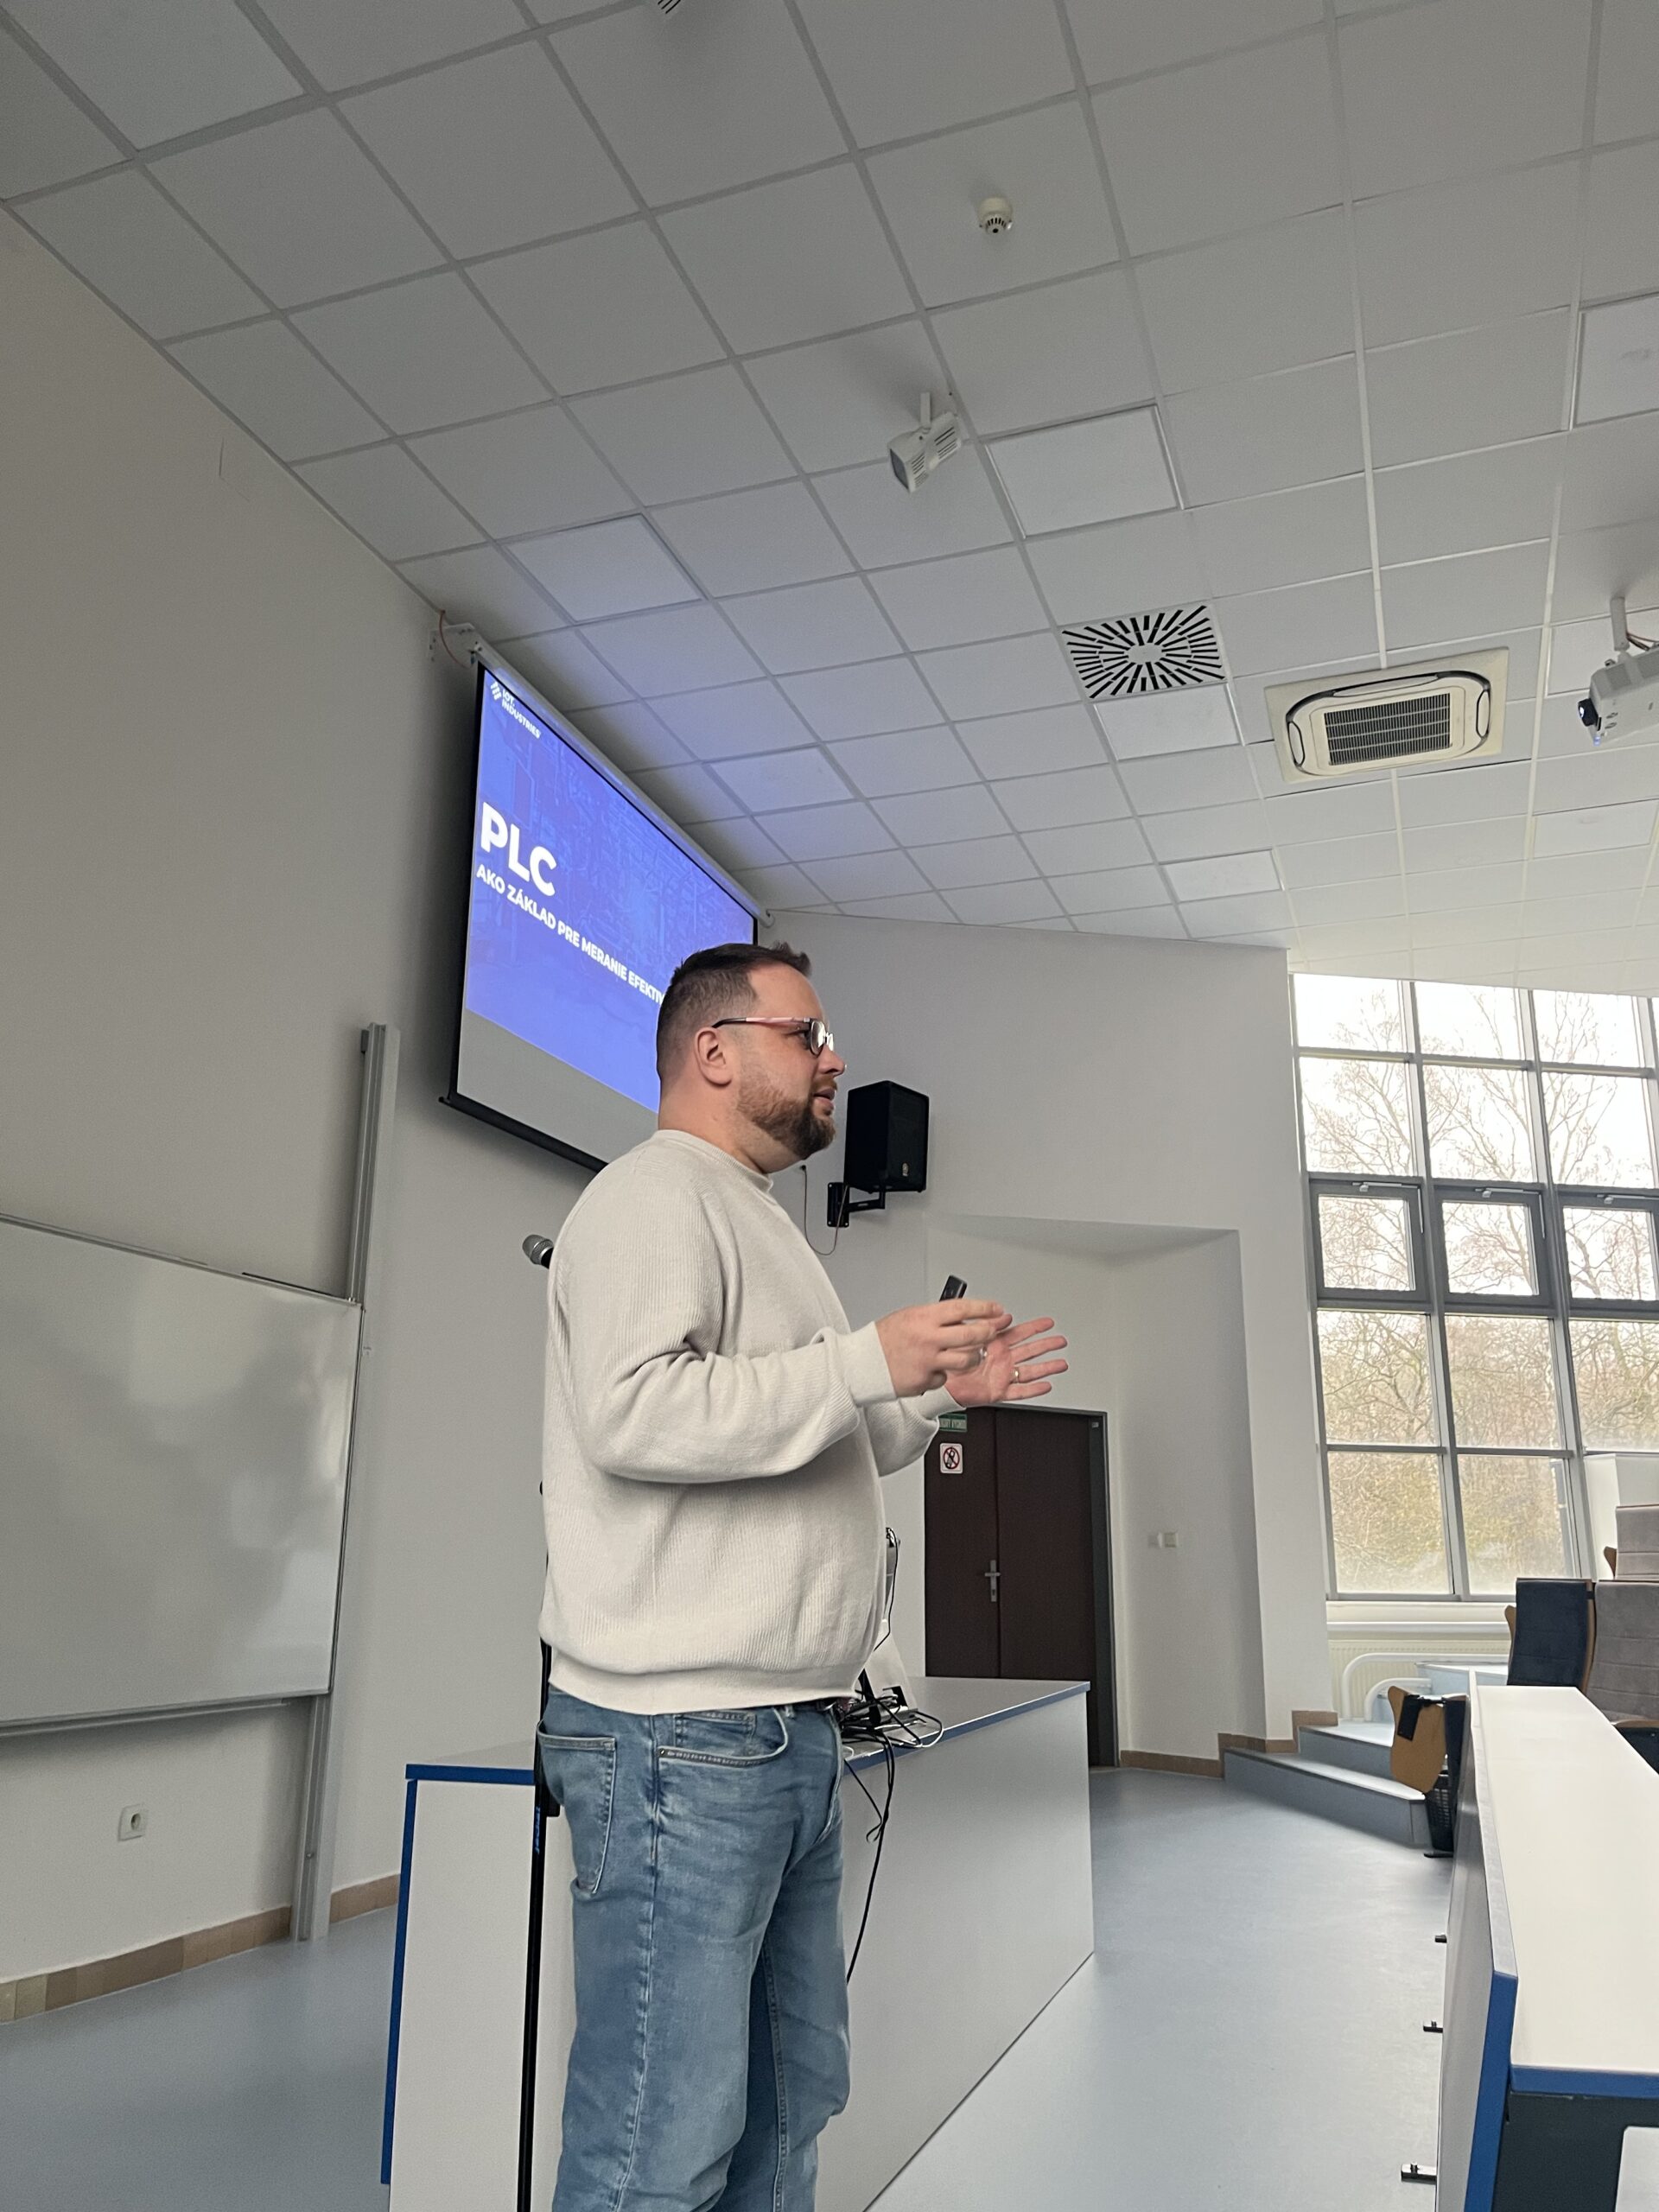
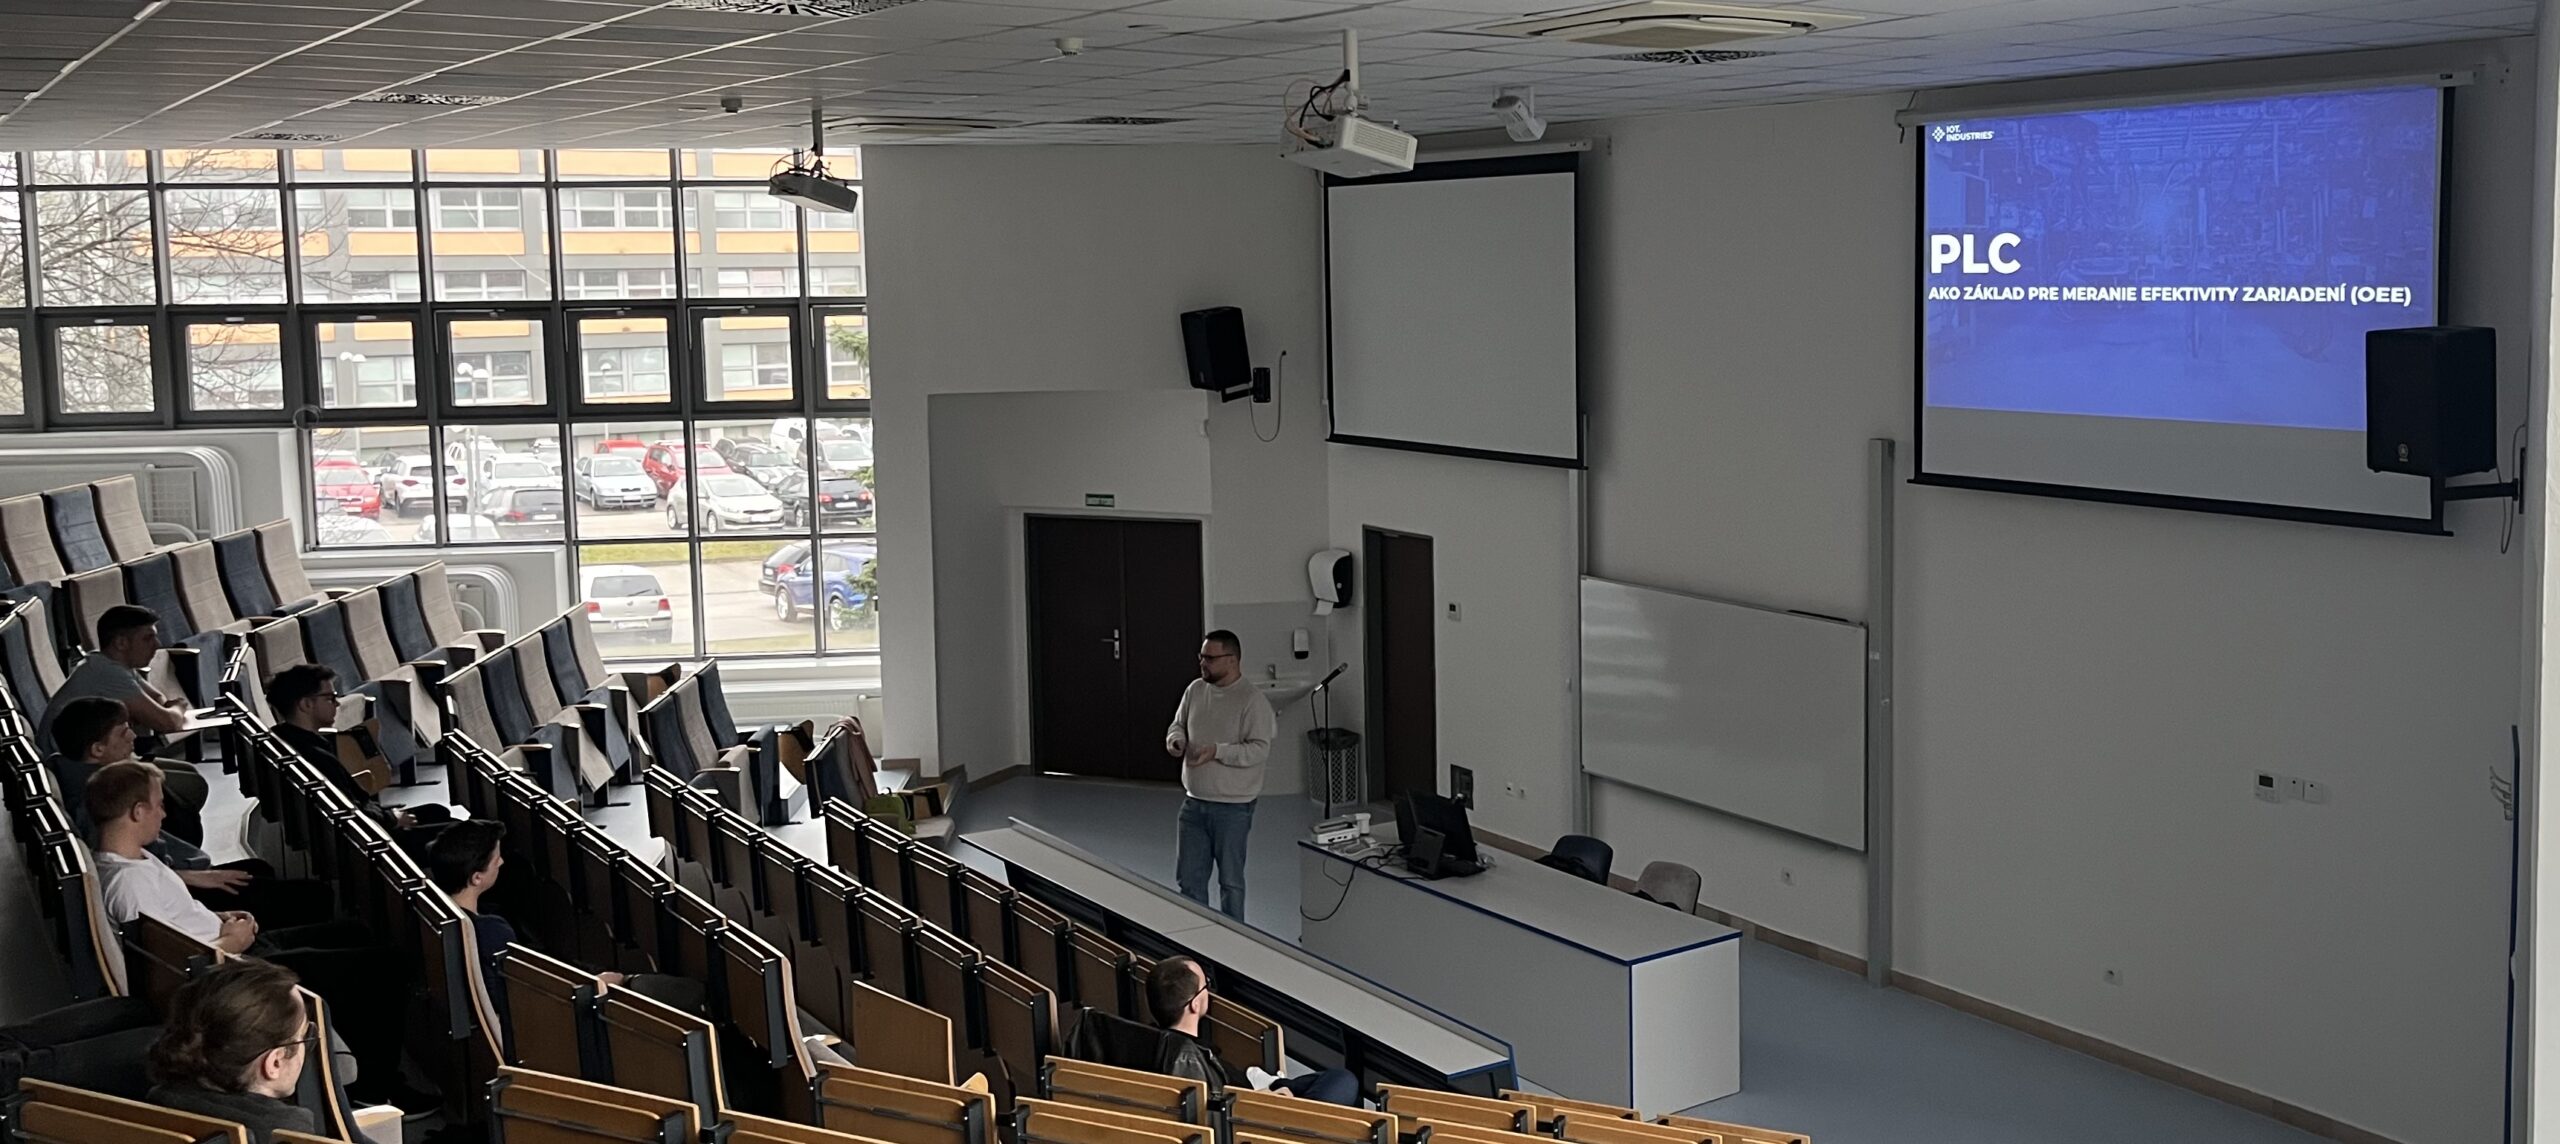
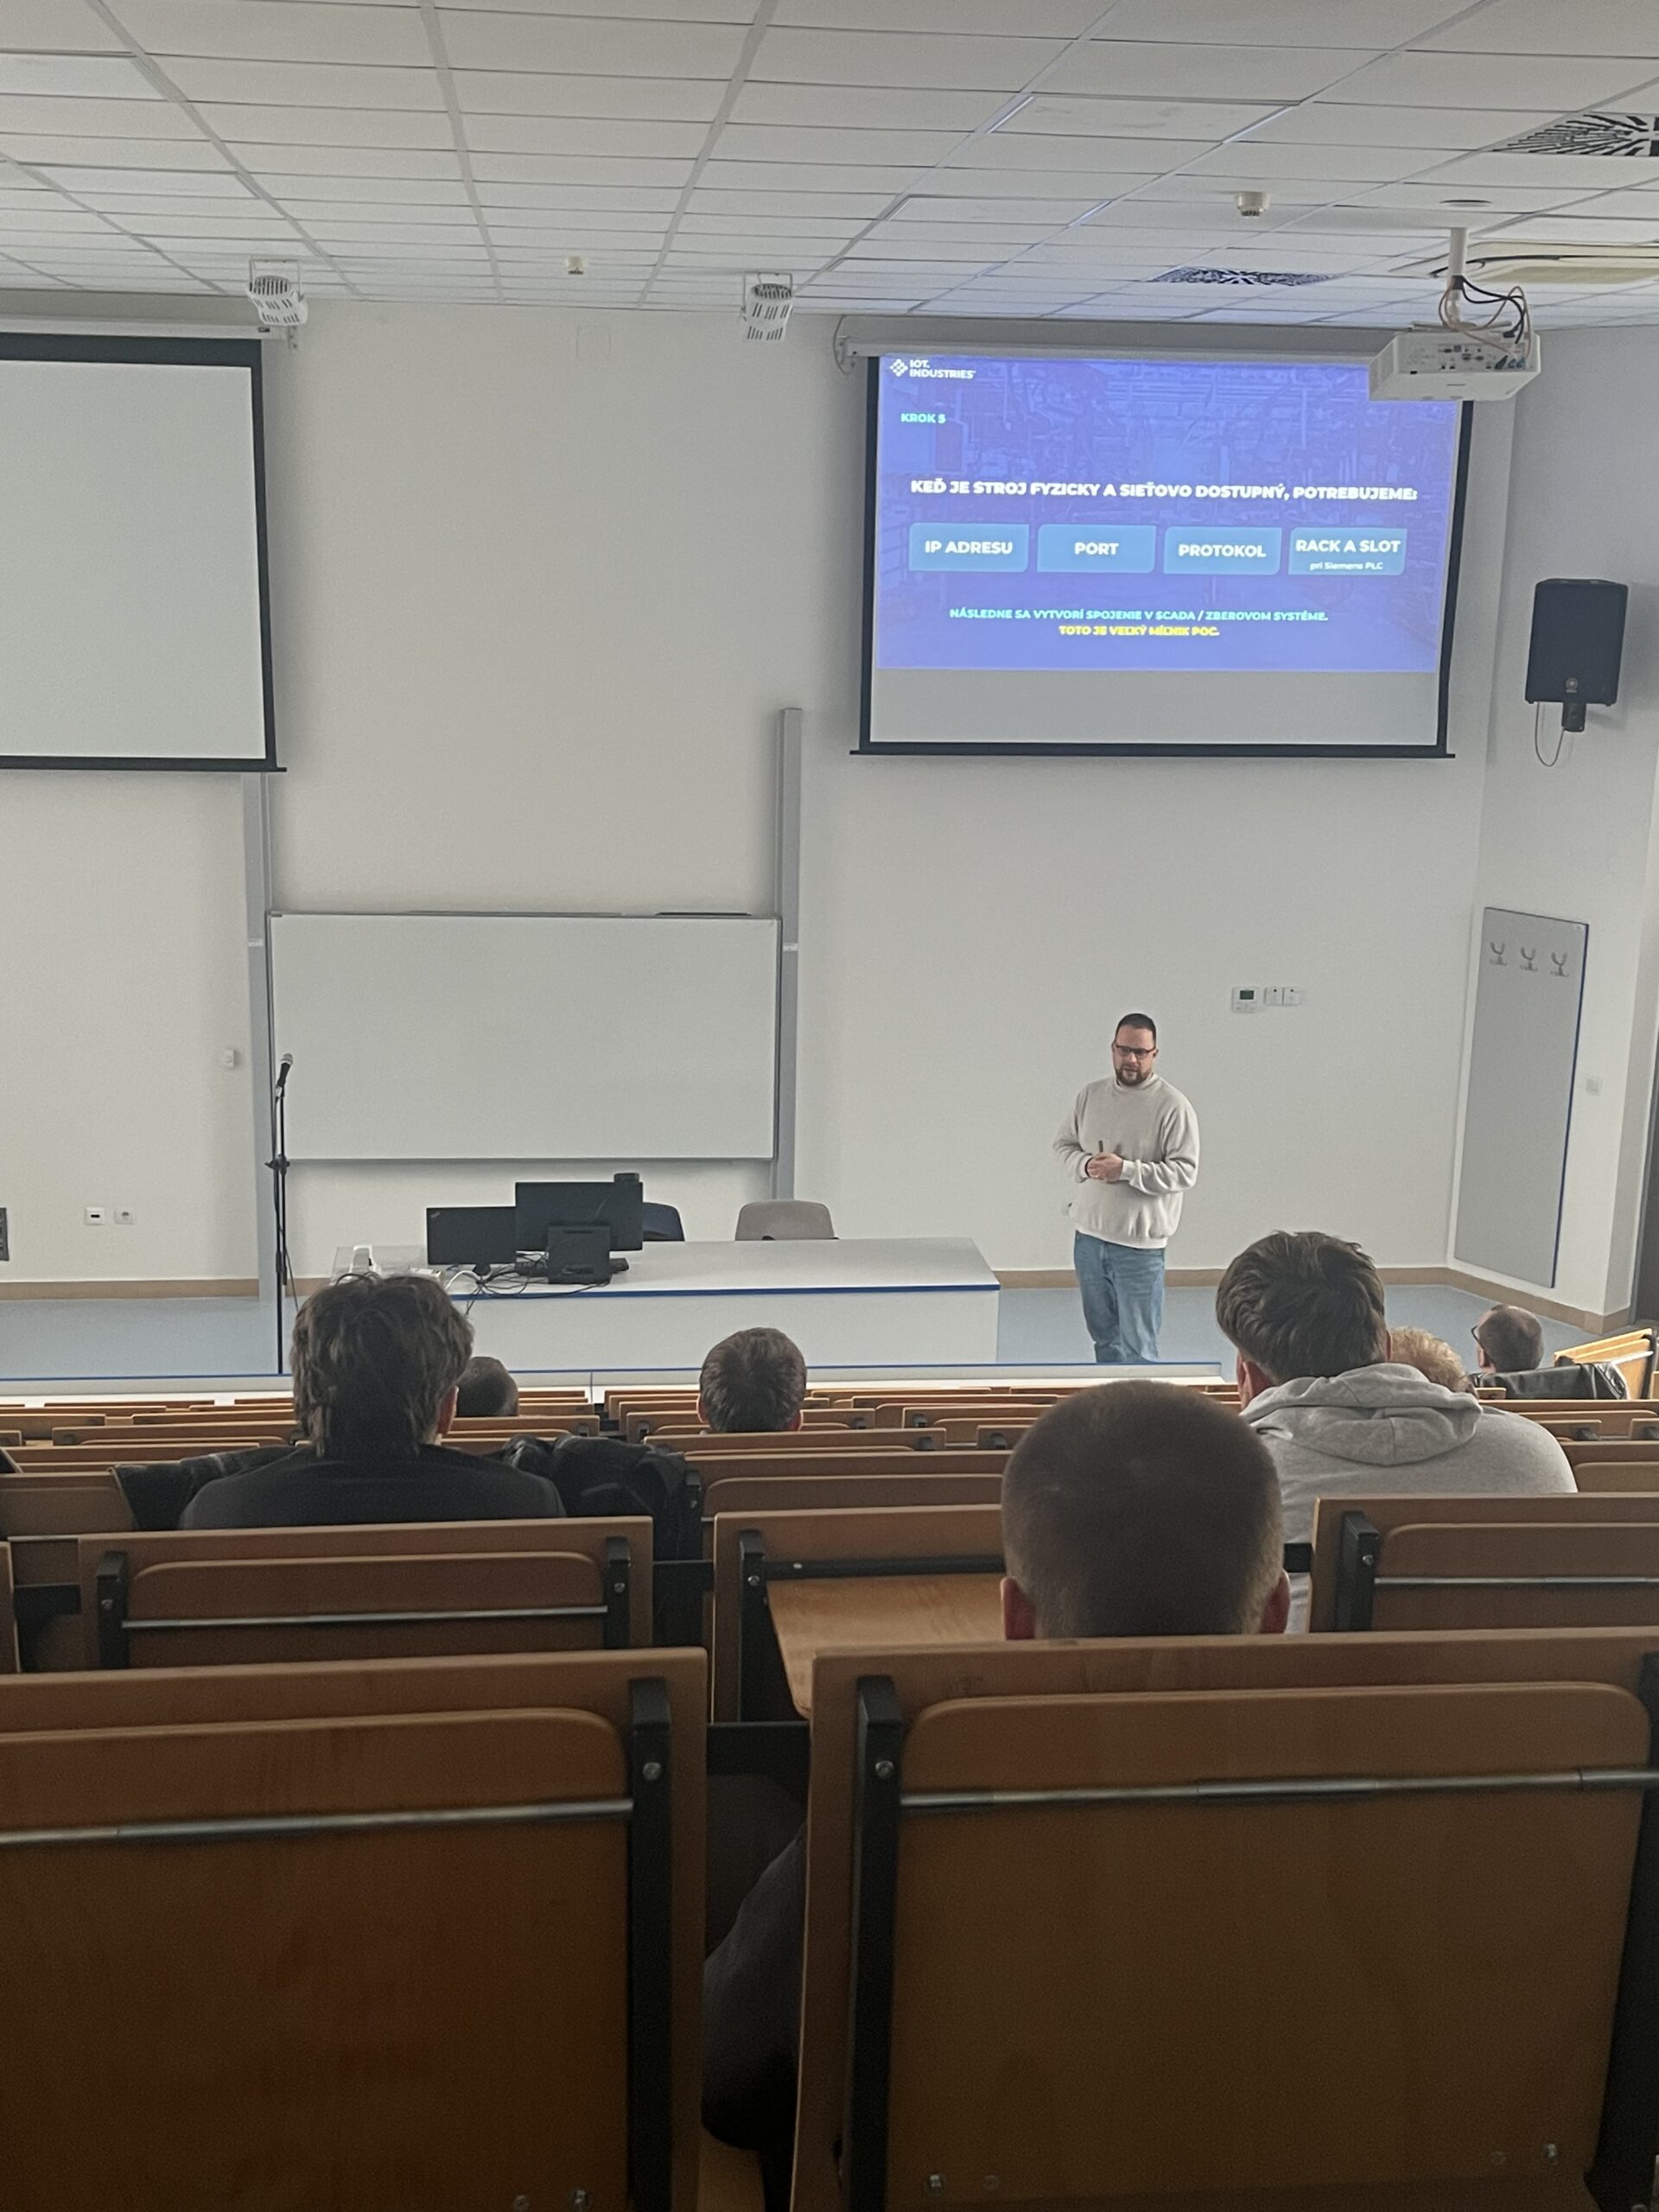
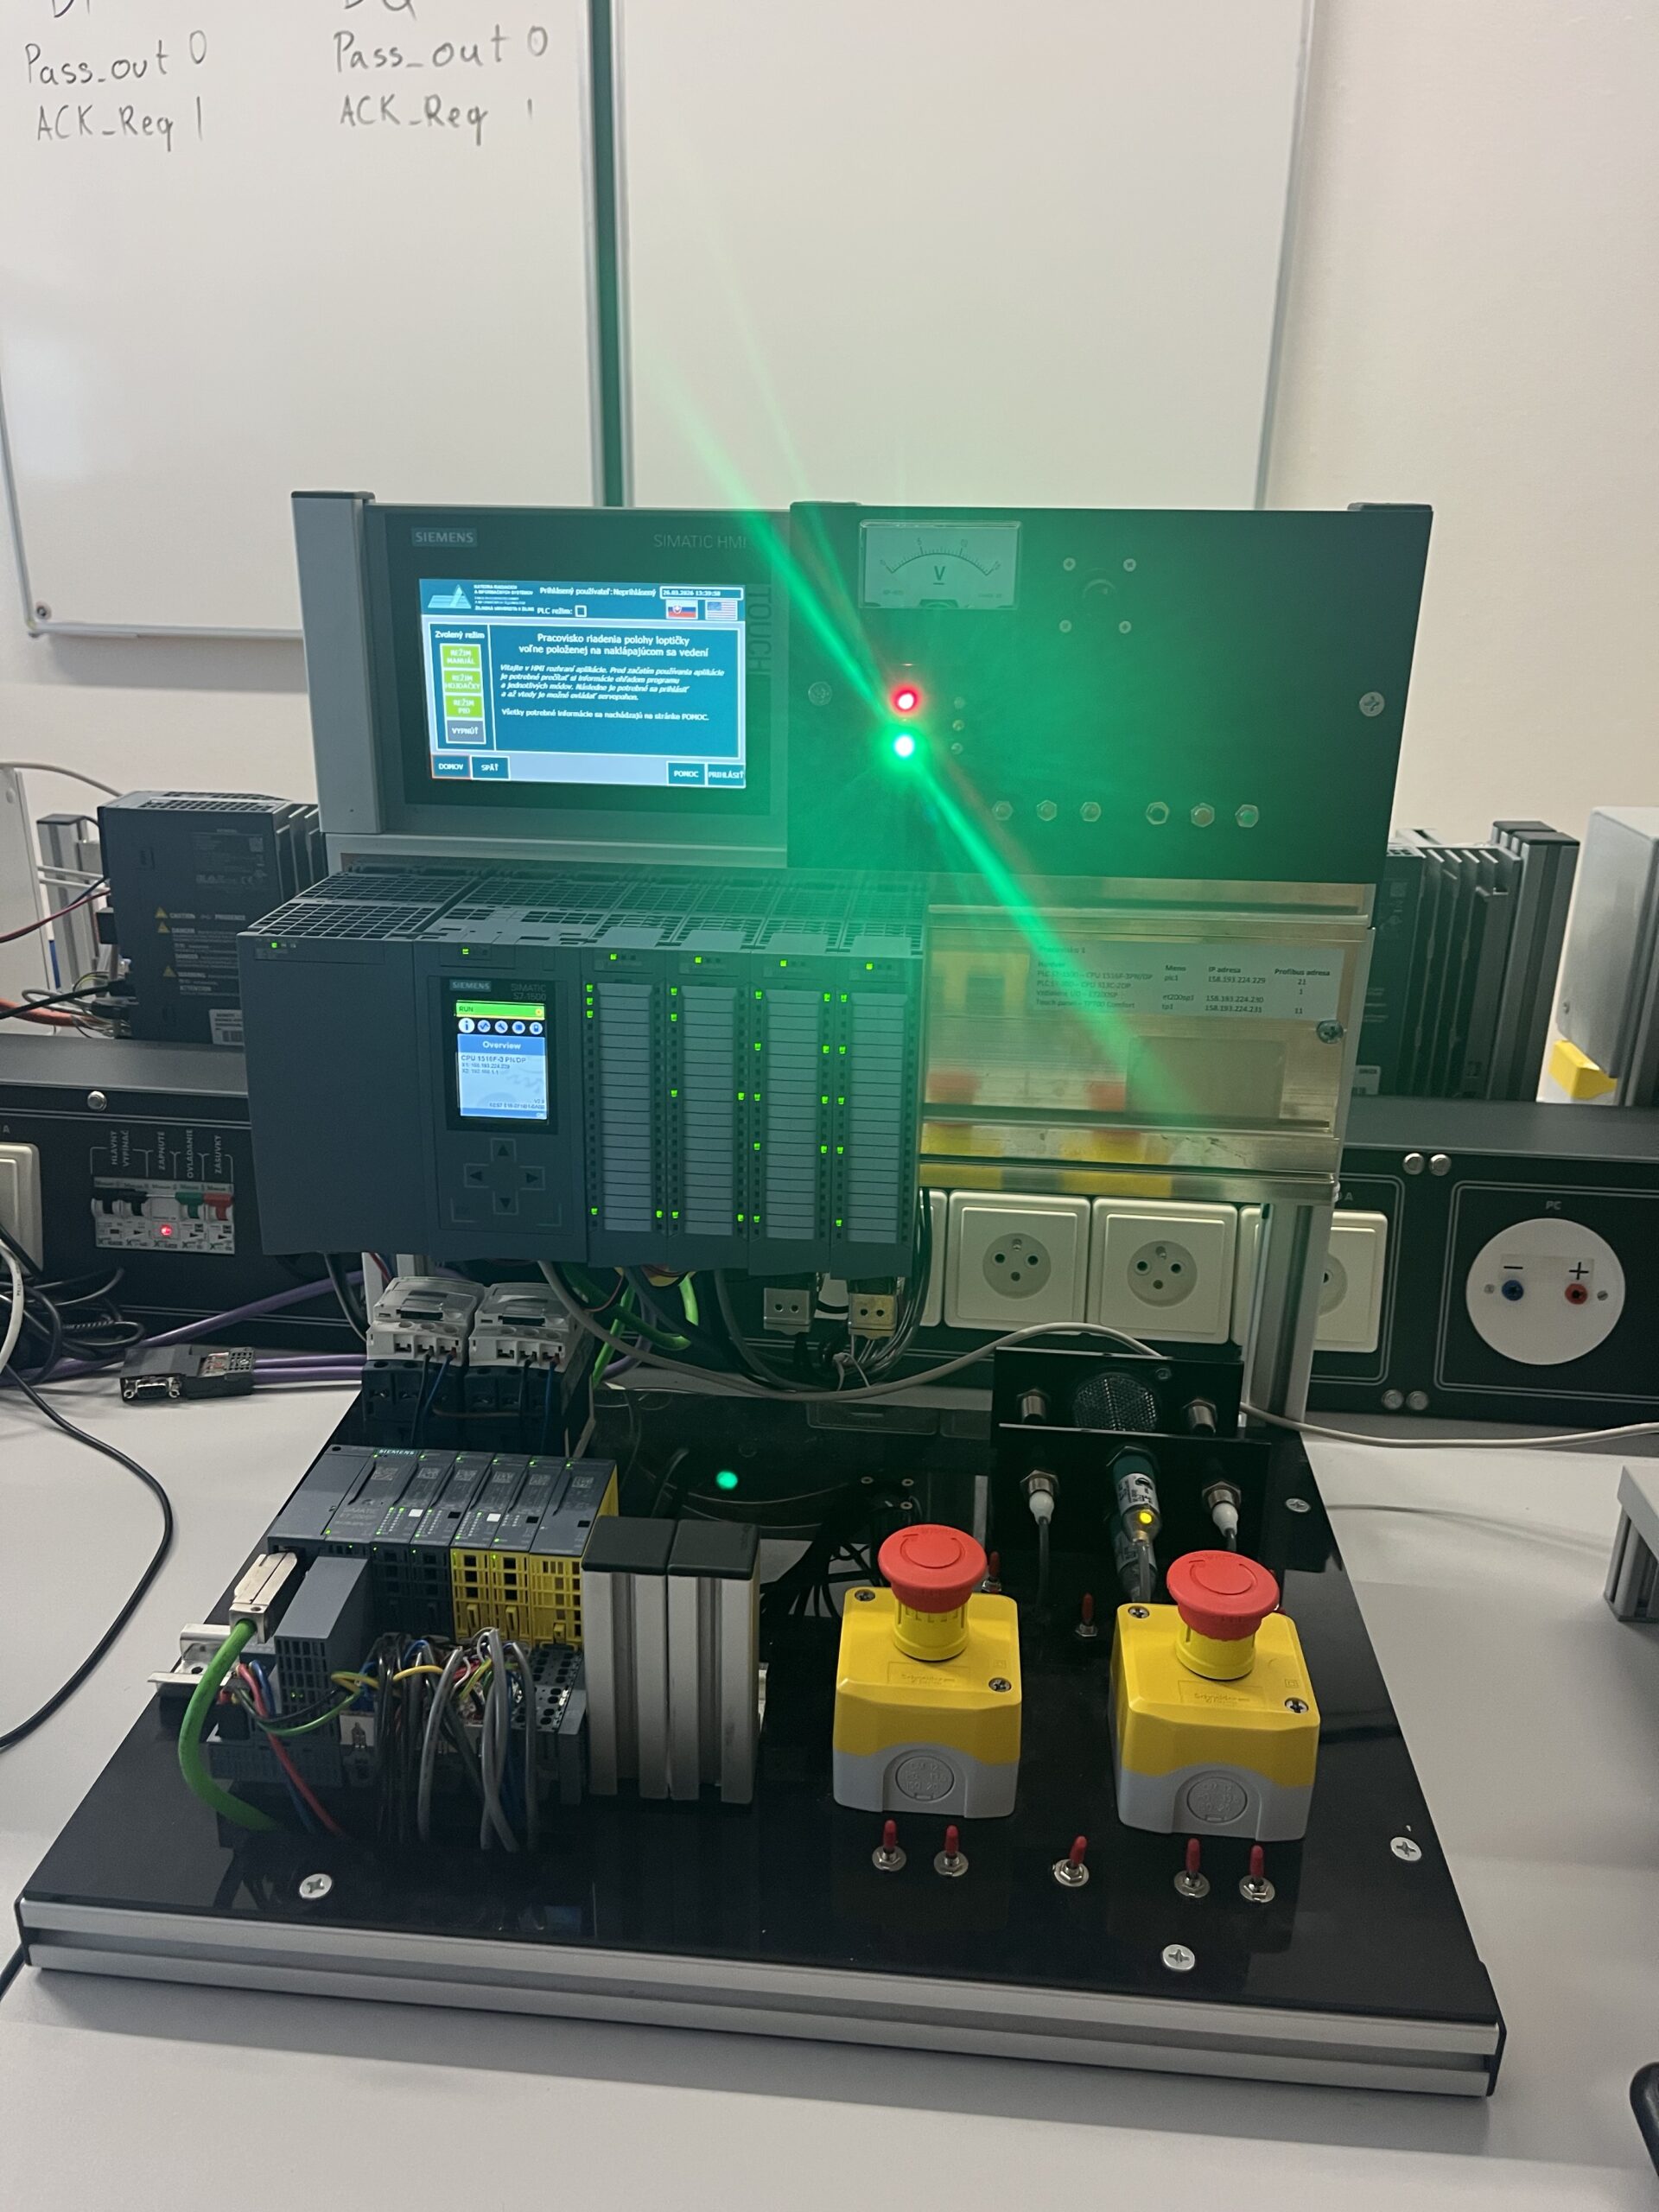
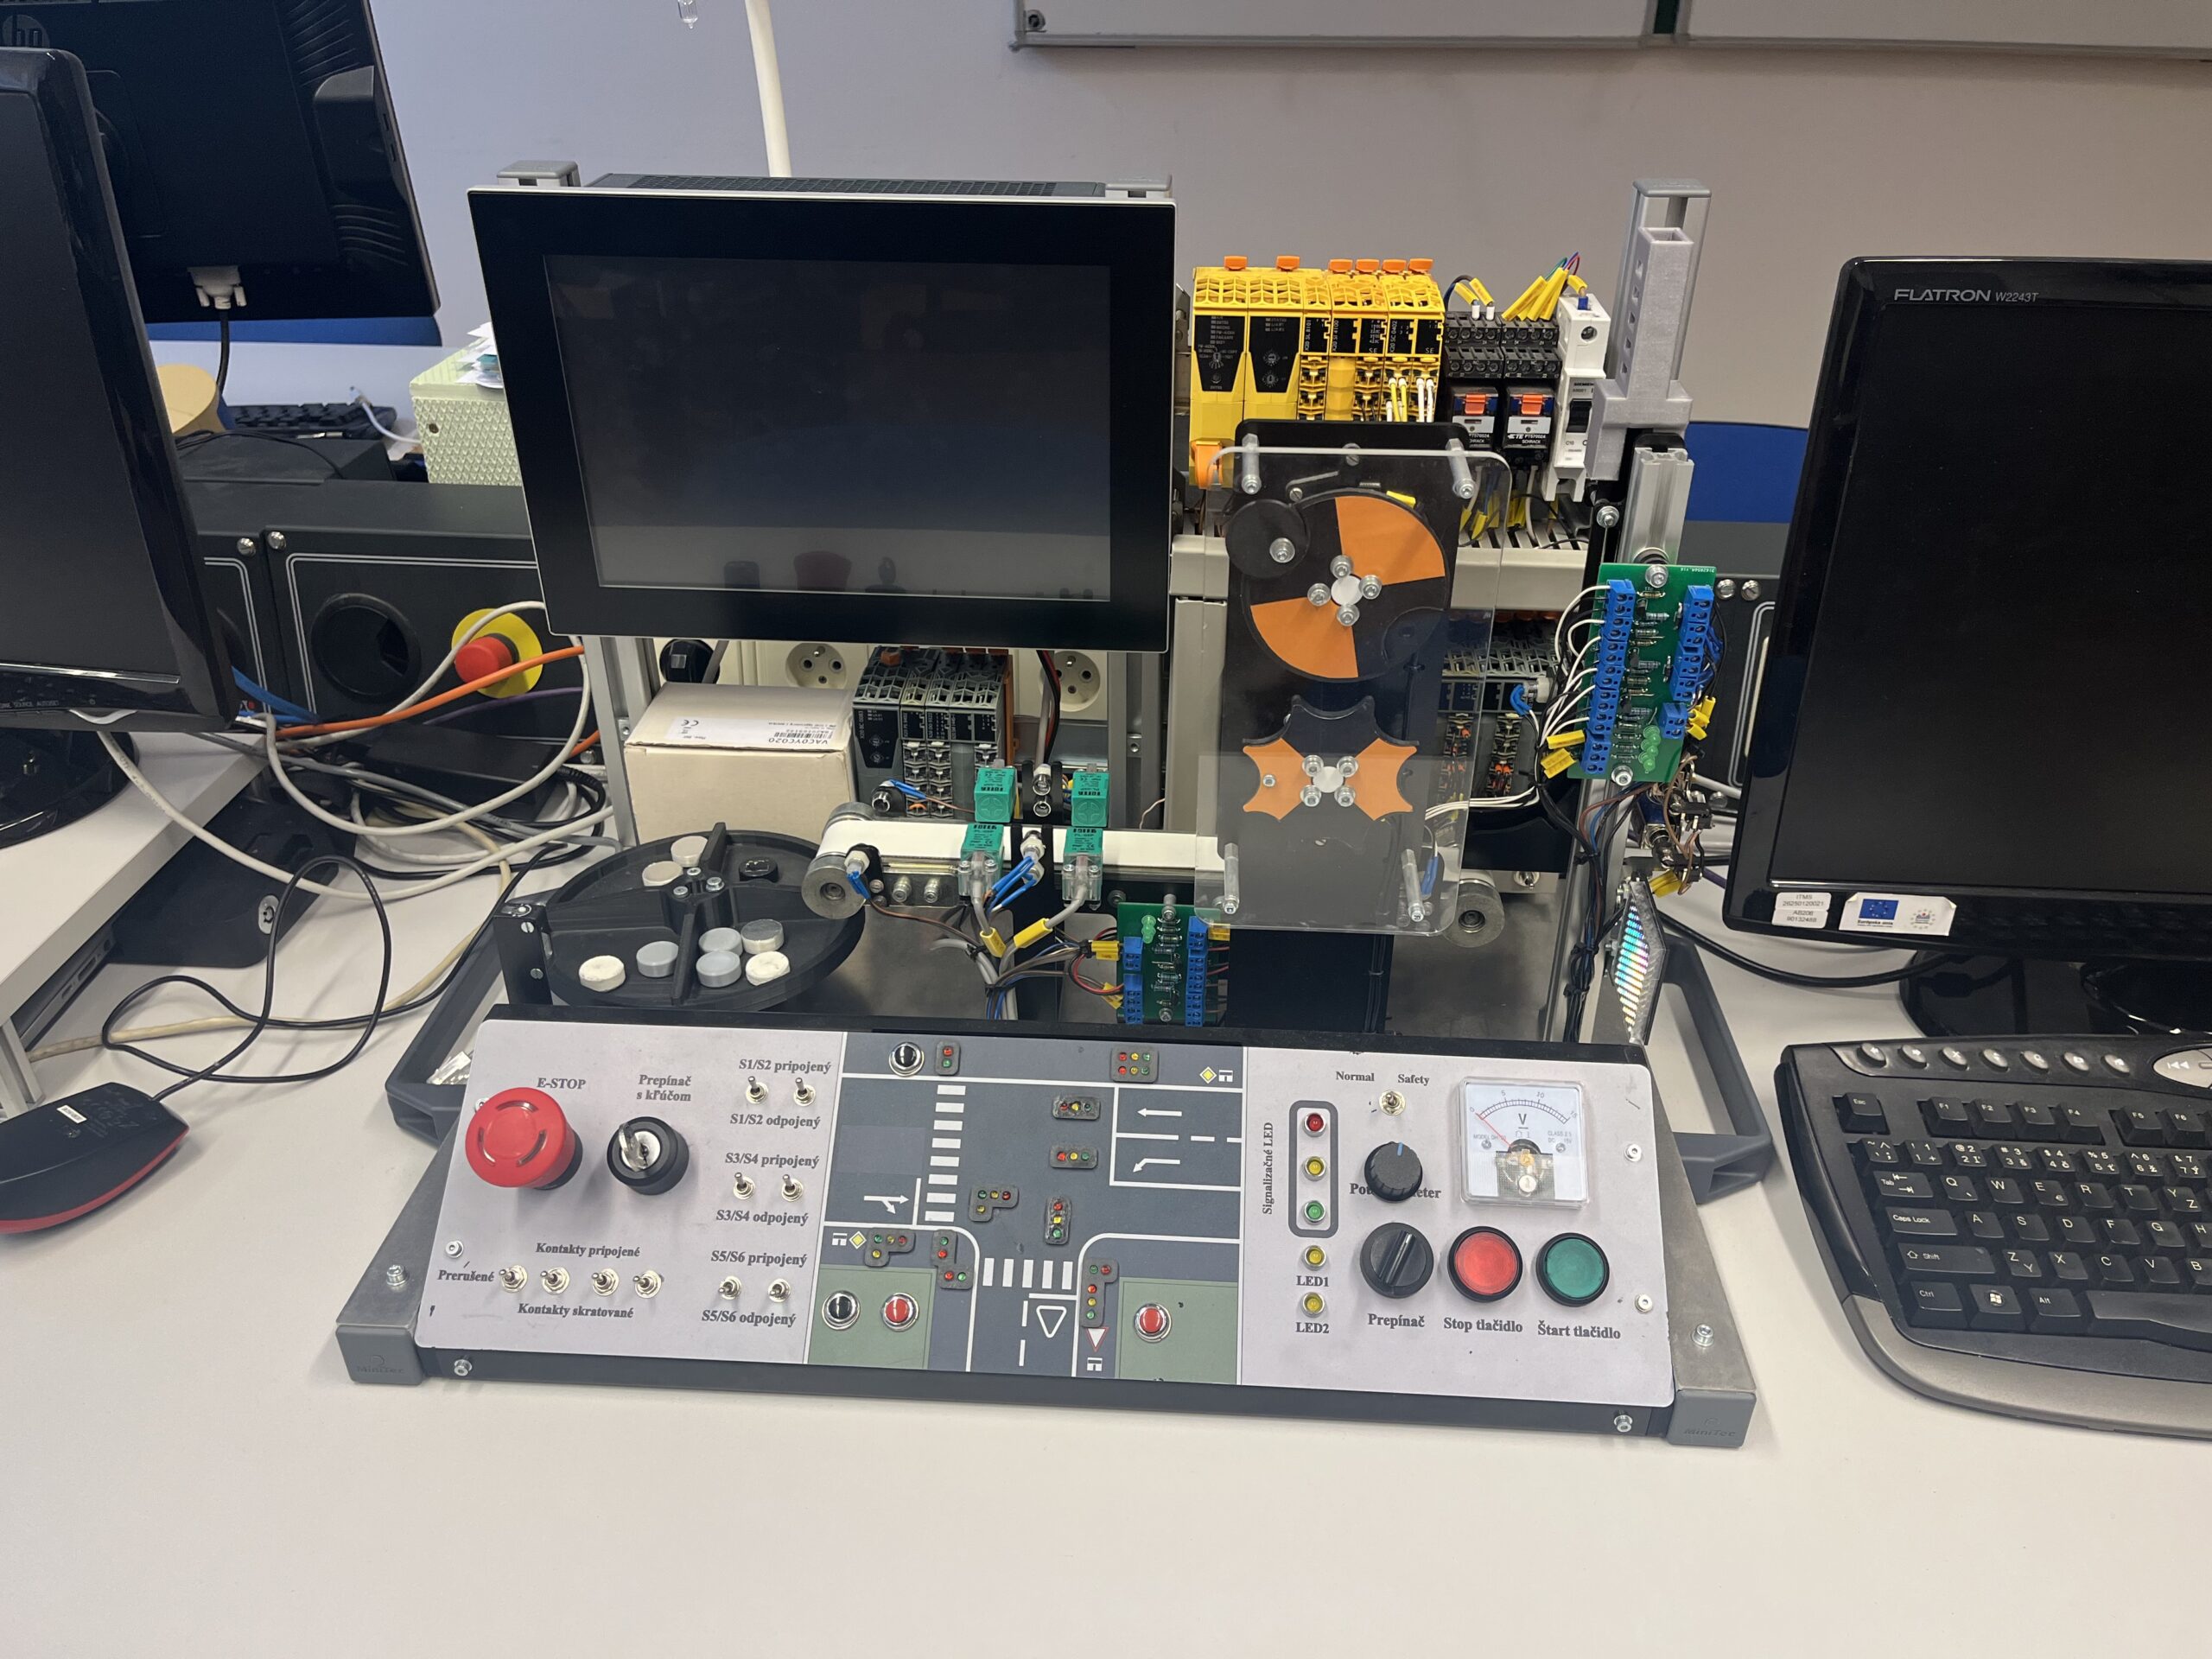
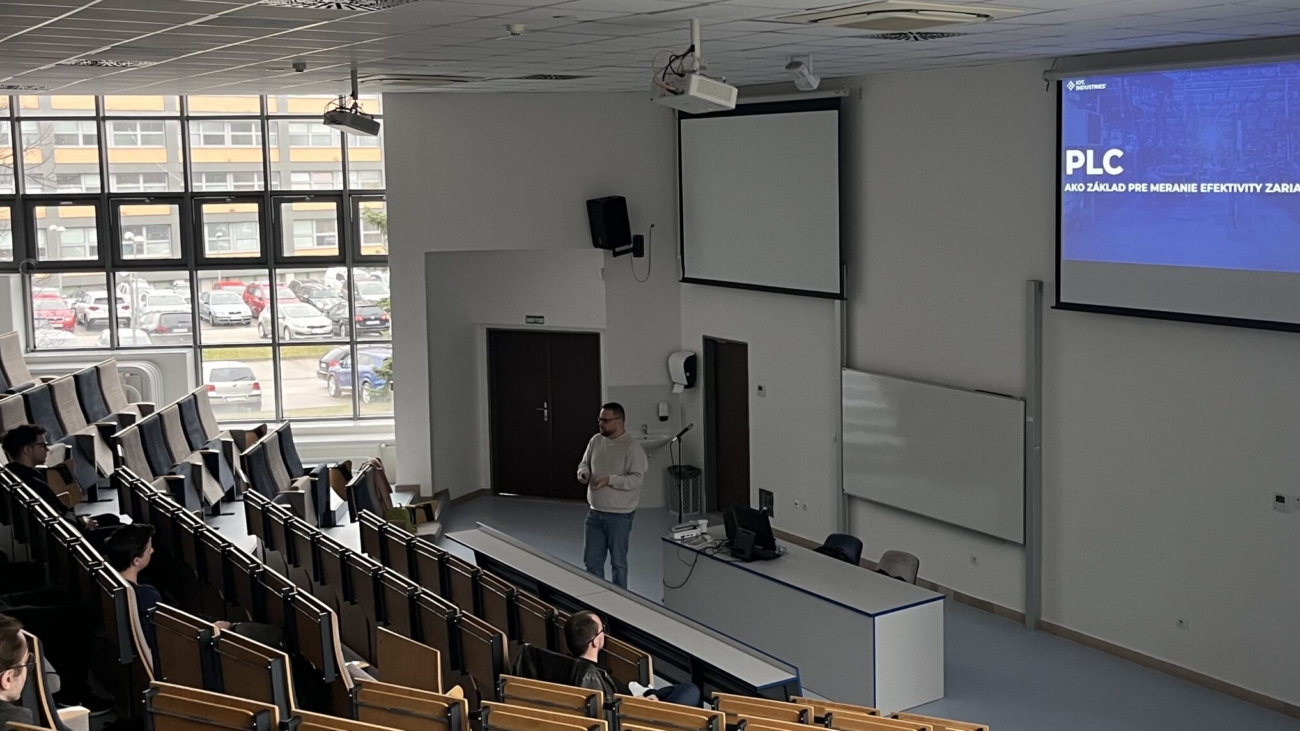
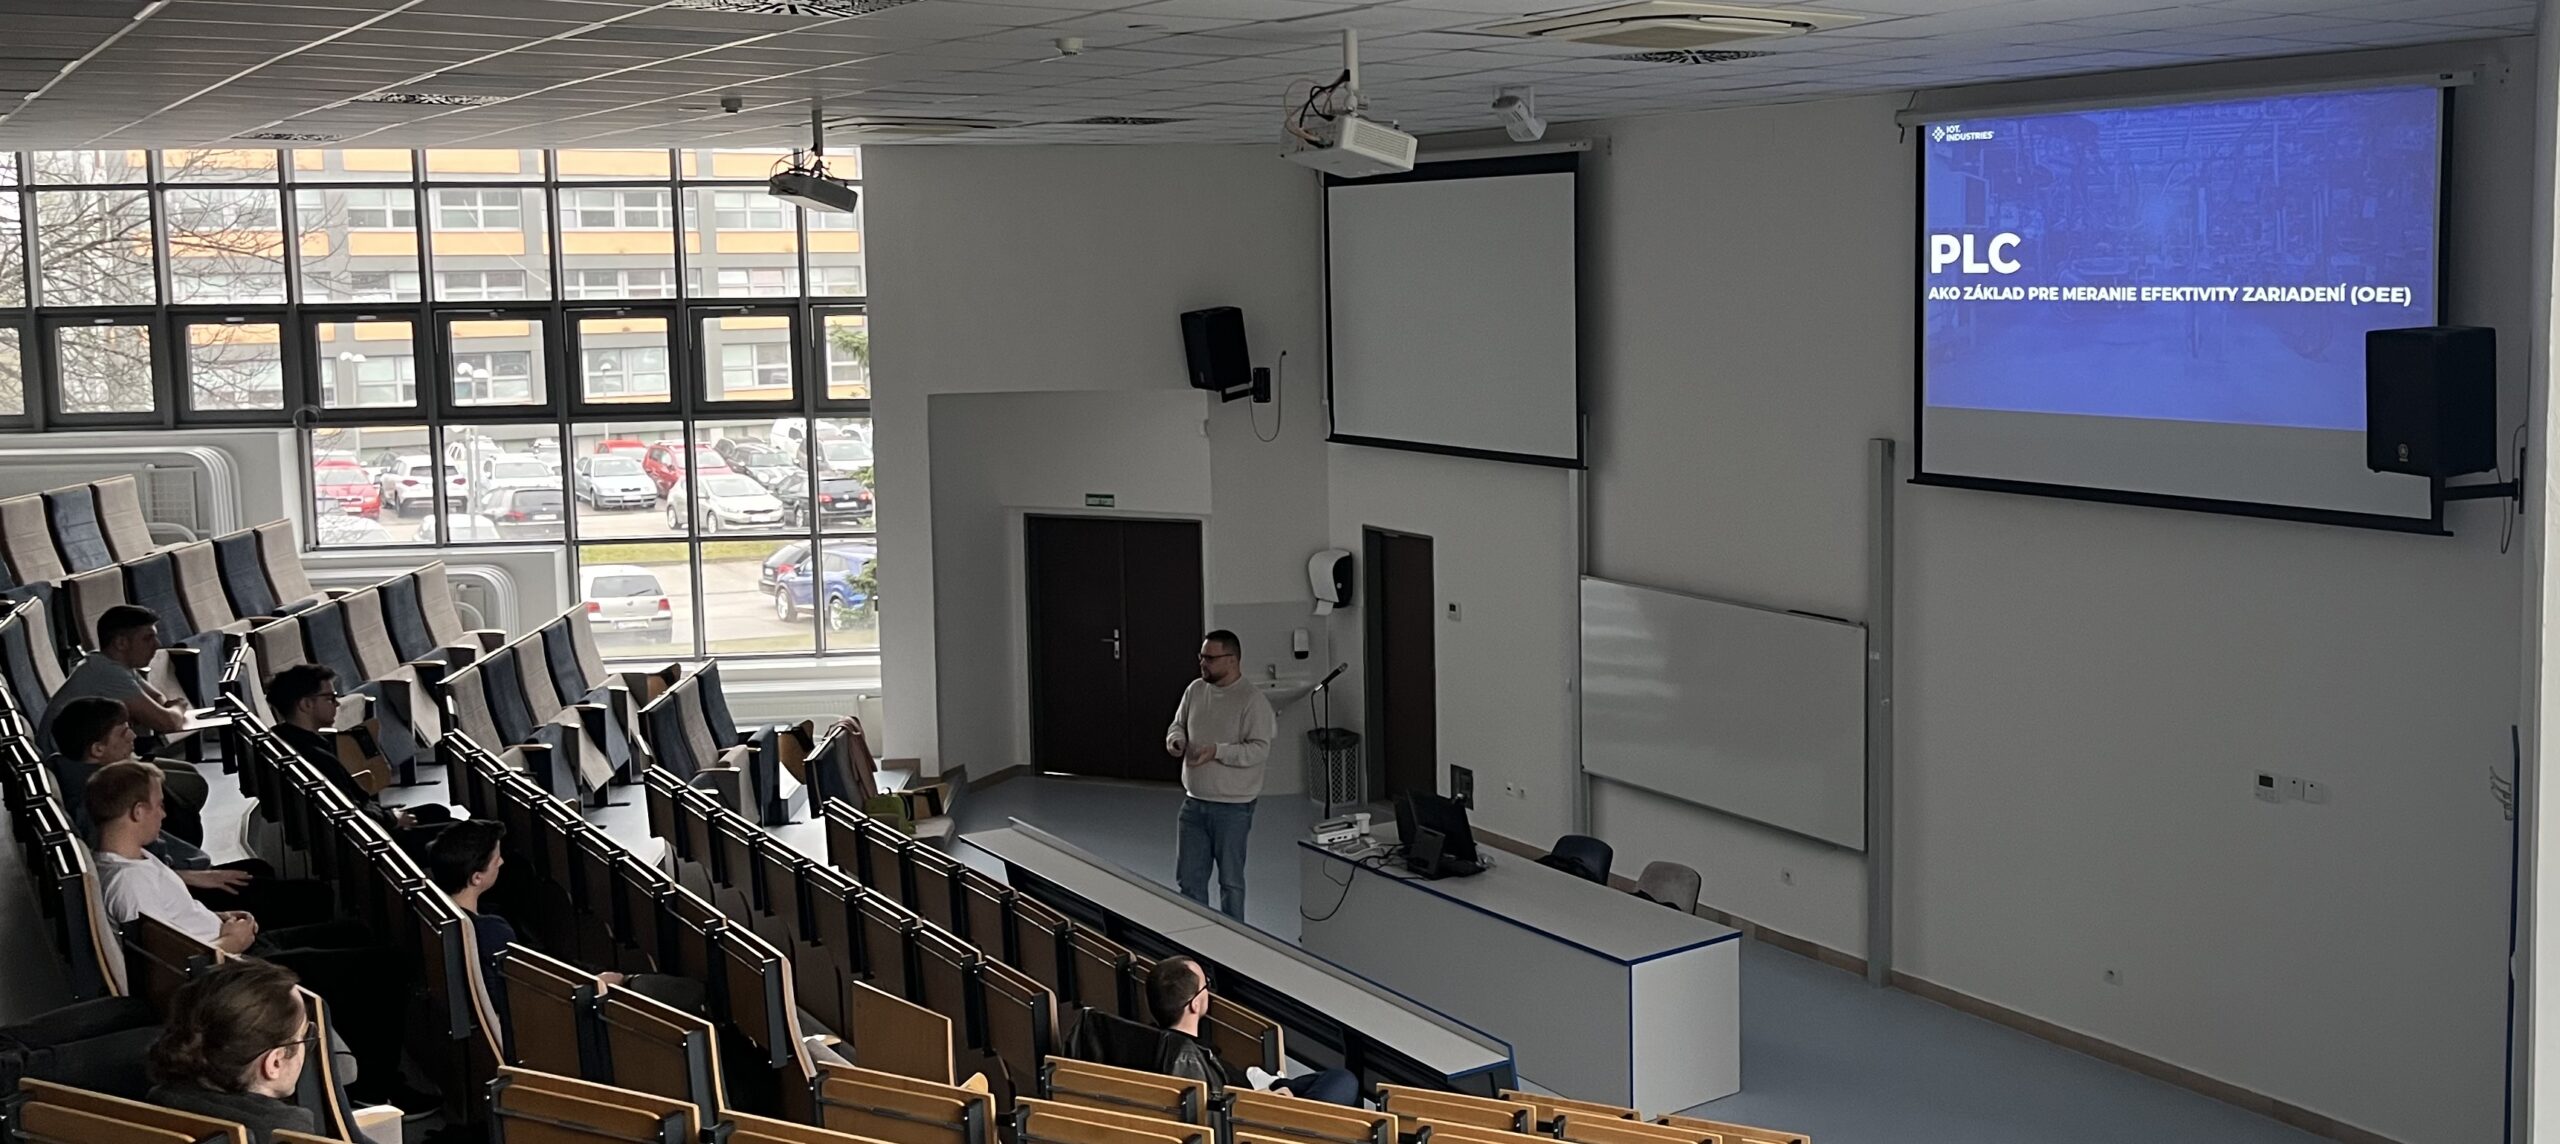
We answered this very question during a lecture at the Faculty of Electrical Engineering and Information Technology of the University of Žilina. The goal was simple – to show students what the implementation of production efficiency measurement looks like in practice. Not company marketing, not recruitment, but the actual work a PLC programmer does every day. And their feedback was surprisingly honest:

“We expected something much worse. This was finally something from real practice.”
PLC ako základ pre meranie efektivity zariadení (OEE) | Realita z praxe, ktorú v škole neuvidíte | PLC as the Foundation for Measuring Equipment Efficiency (OEE) | Real-World Insights You Won’t Learn at School

PLC – A data source for decision-making across the entire enterprise

PLC (Programmable Logic Controller) is often referred to as the “brain of the machine.” It controls its operation, responds to inputs, and ensures safety. All of that is true, but in modern manufacturing, its importance goes much further. Today, PLC is above all a source of data. Without it, you cannot know when a machine is actually producing, when it is idle and why, what its performance is, or what quality it achieves… And without this information, it is impossible to manage production effectively. A modern manufacturing company does not rely on estimates, but on accurate and up-to-date data.

OEE – The indicator that reveals the reality of production

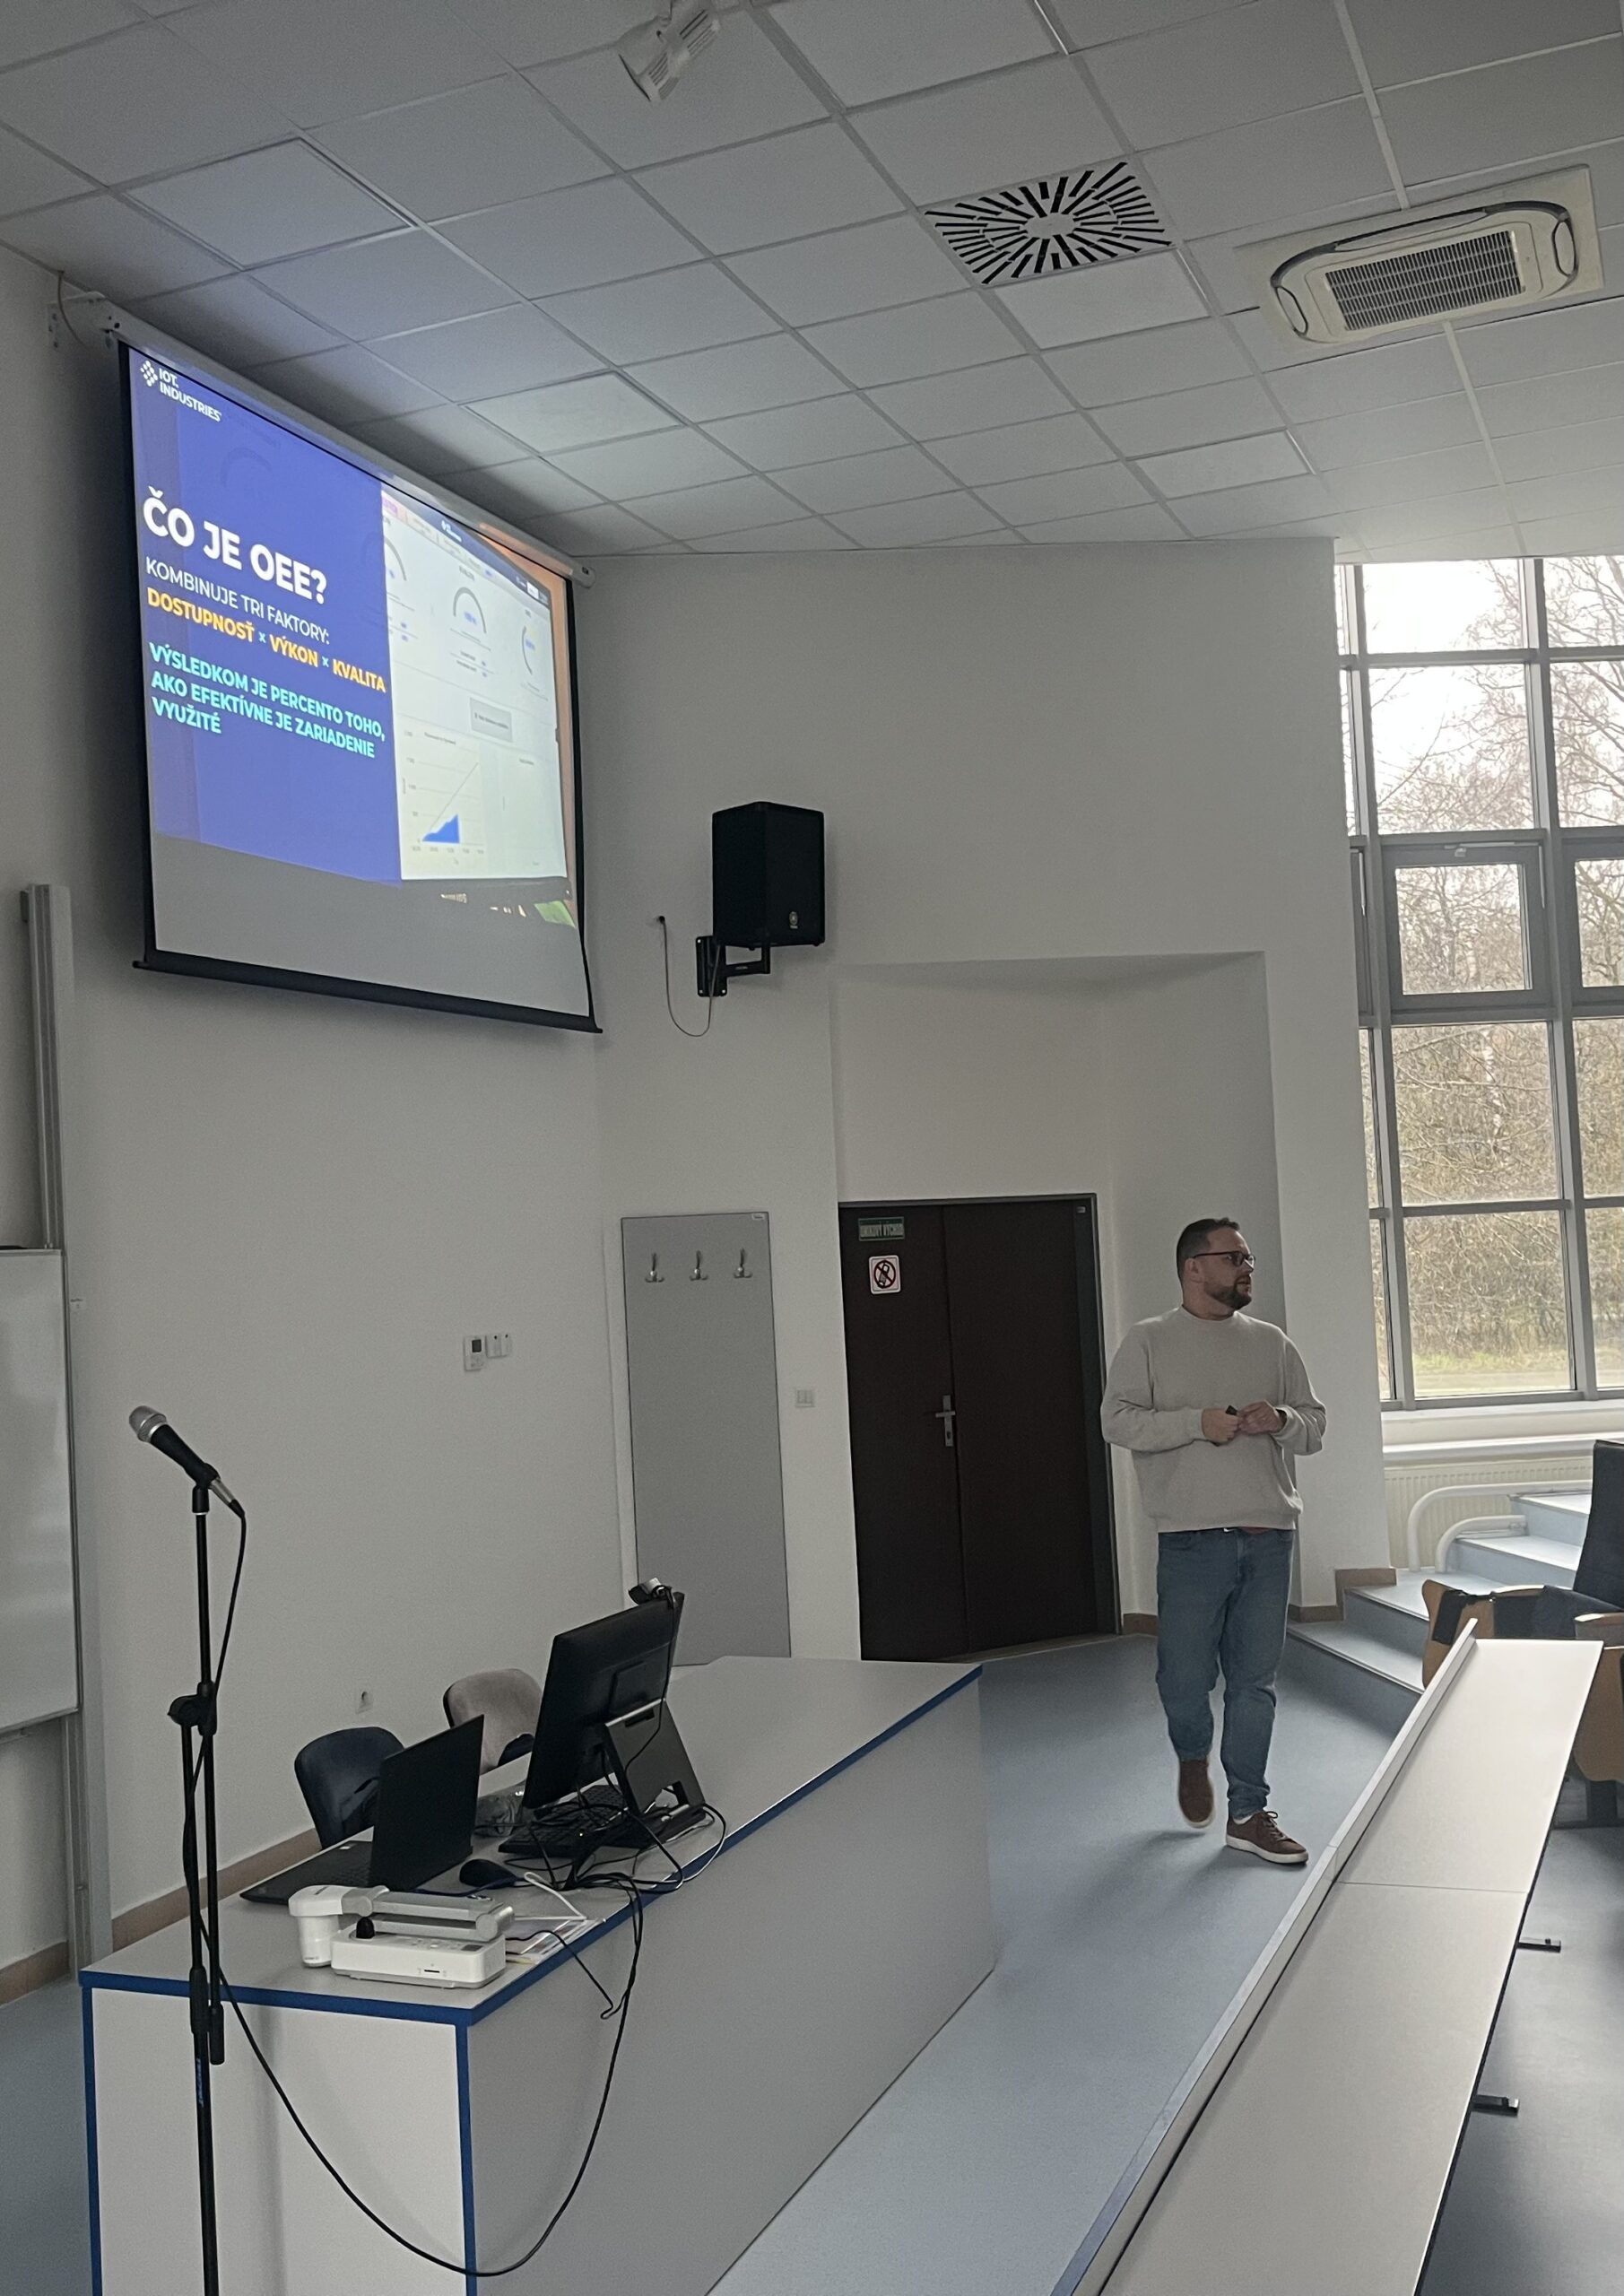
When we talk about production efficiency, sooner or later we arrive at the indicator OEE (Overall Equipment Effectiveness). OEE combines three key factors: availability (whether the machine is actually producing), performance (how fast it produces), and quality (how many units meet the required standards). The result is a single number that reveals how efficiently the equipment is utilized. However, OEE is only as accurate as the input data. If the input data is inaccurate or incomplete, the result has no real explanatory value. And that is exactly why PLC is the absolute foundation.

Why do most OEE projects fail?

From a practical perspective, the biggest problem is not calculating OEE. That part is relatively simple. The problem is data collection. Many companies still operate in a way where operators record data manually, downtime is categorized based on estimates, and performance is calculated from plans, not reality. The result? OEE may look good on paper, but it does not reflect the actual state of production. The company believes it operates efficiently, while in reality it is losing a significant portion of its potential.

What does OEE implementation look like in practice?

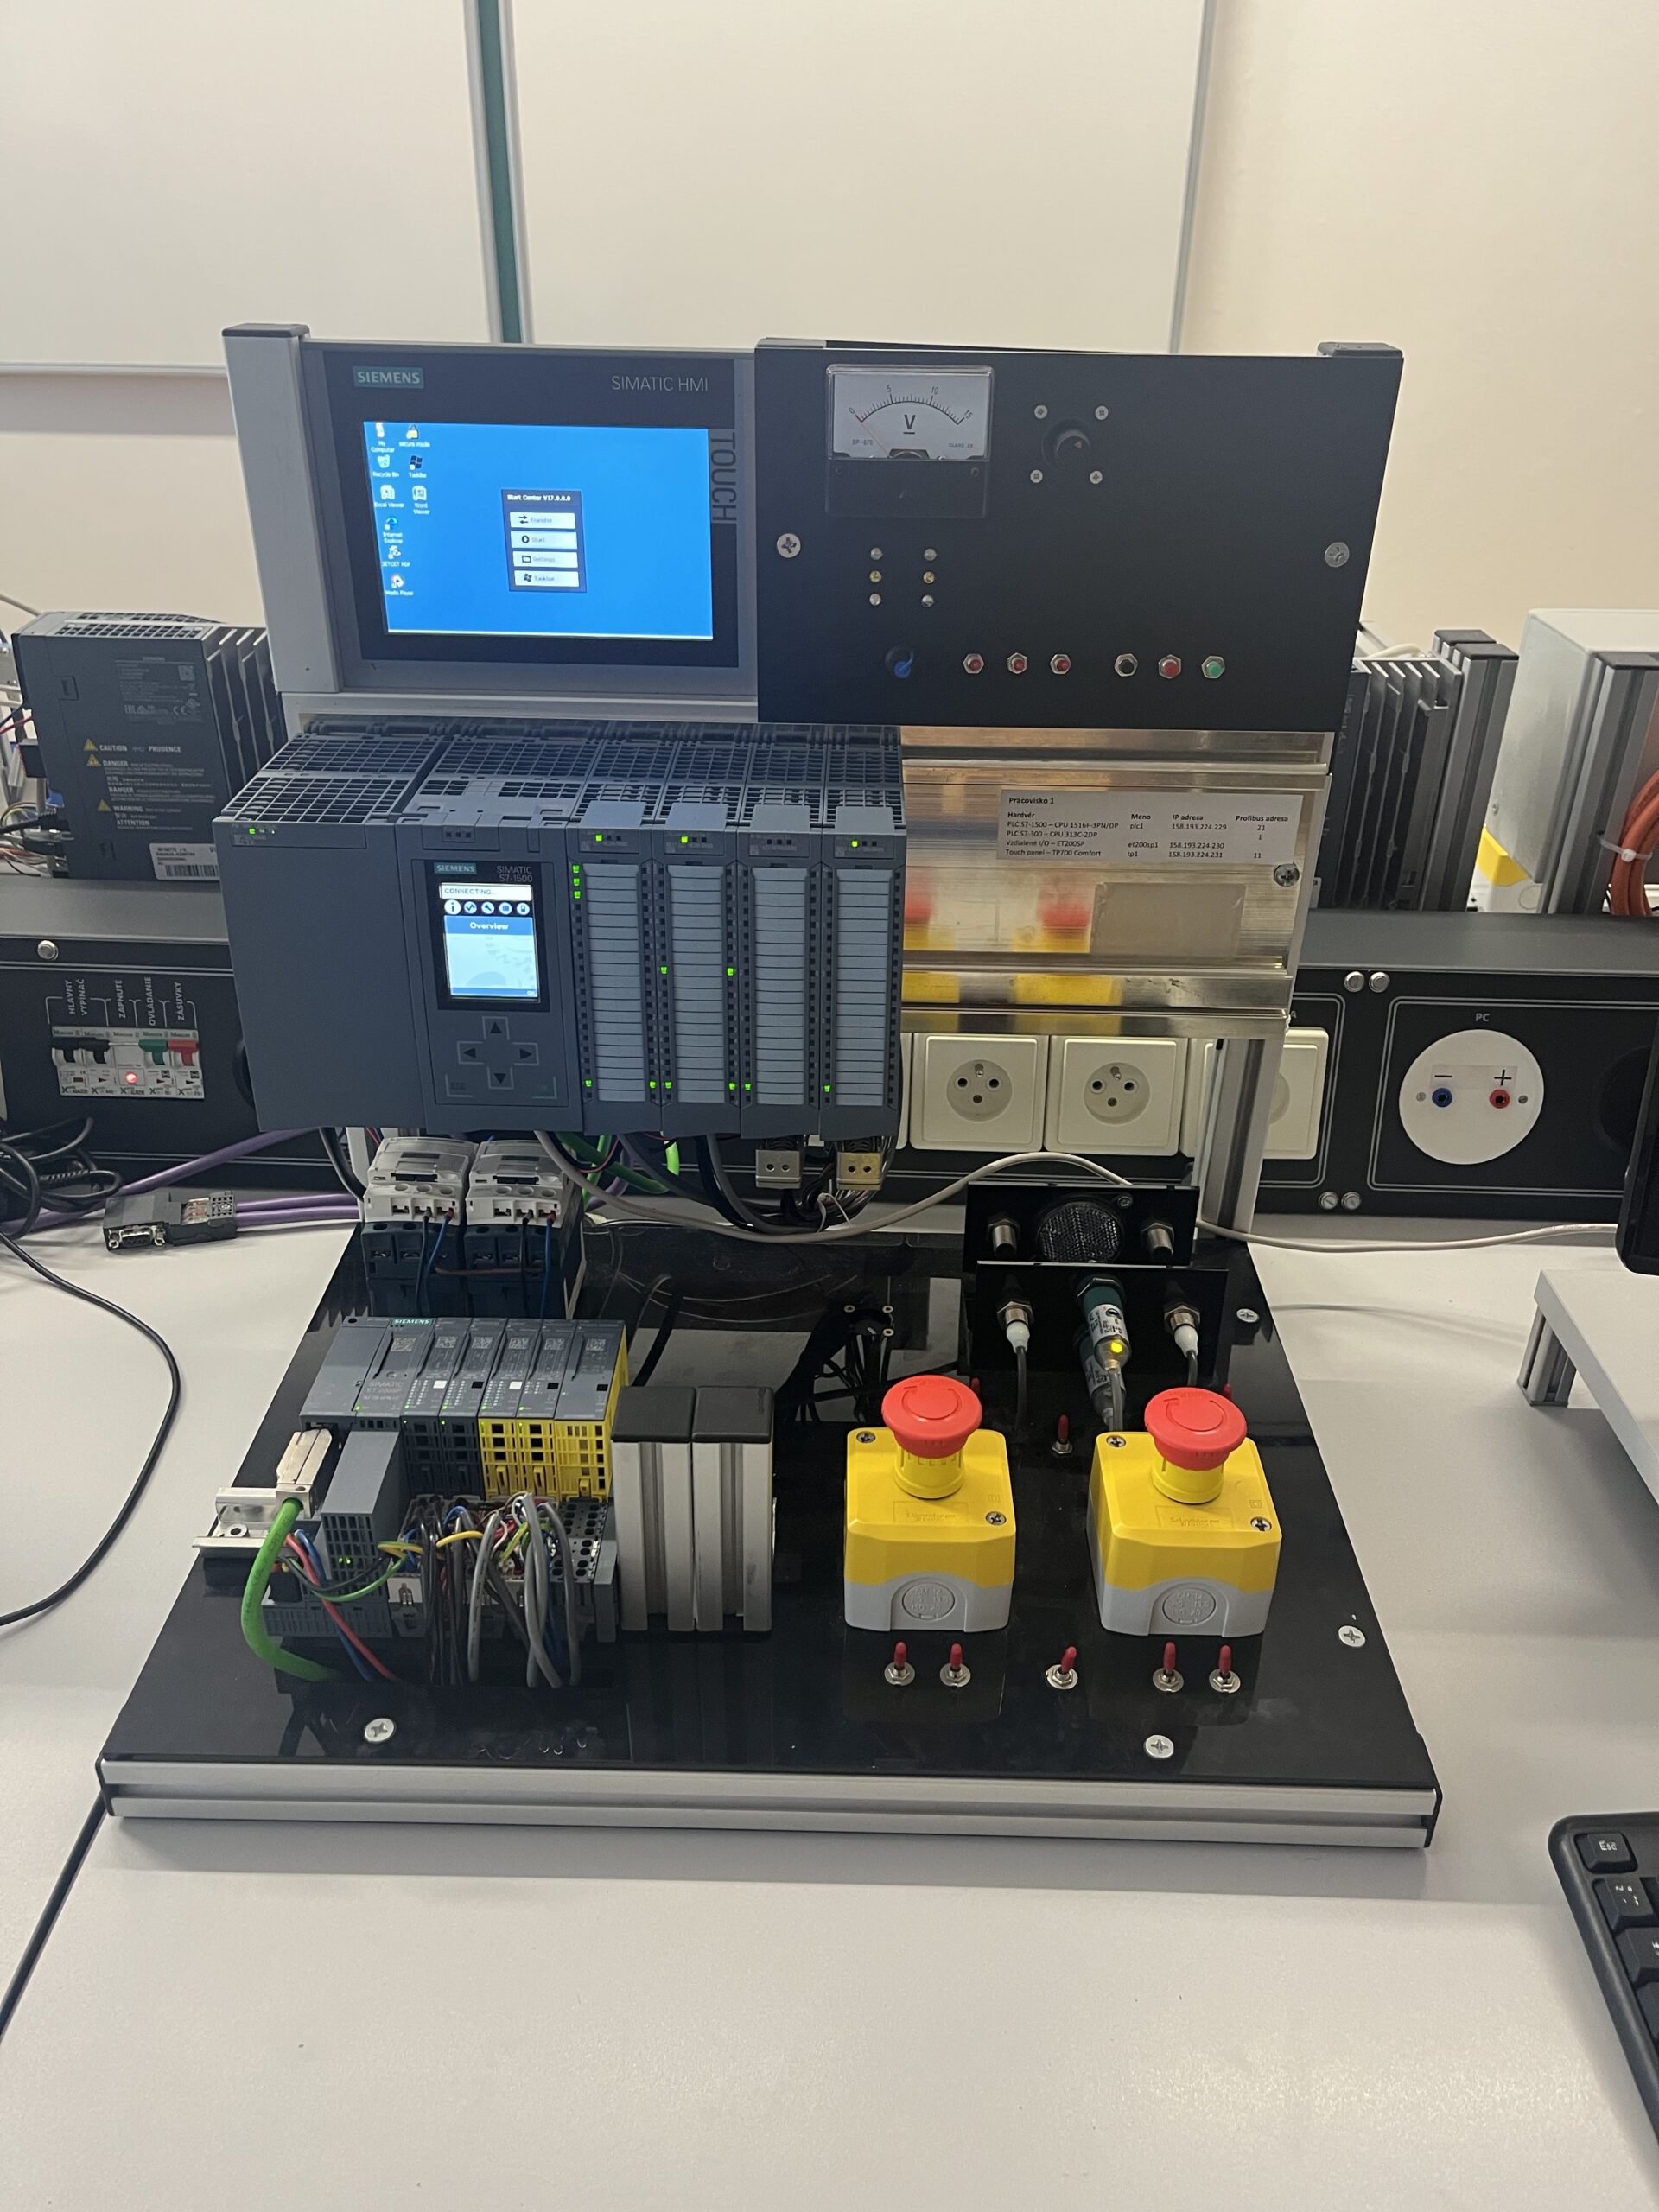
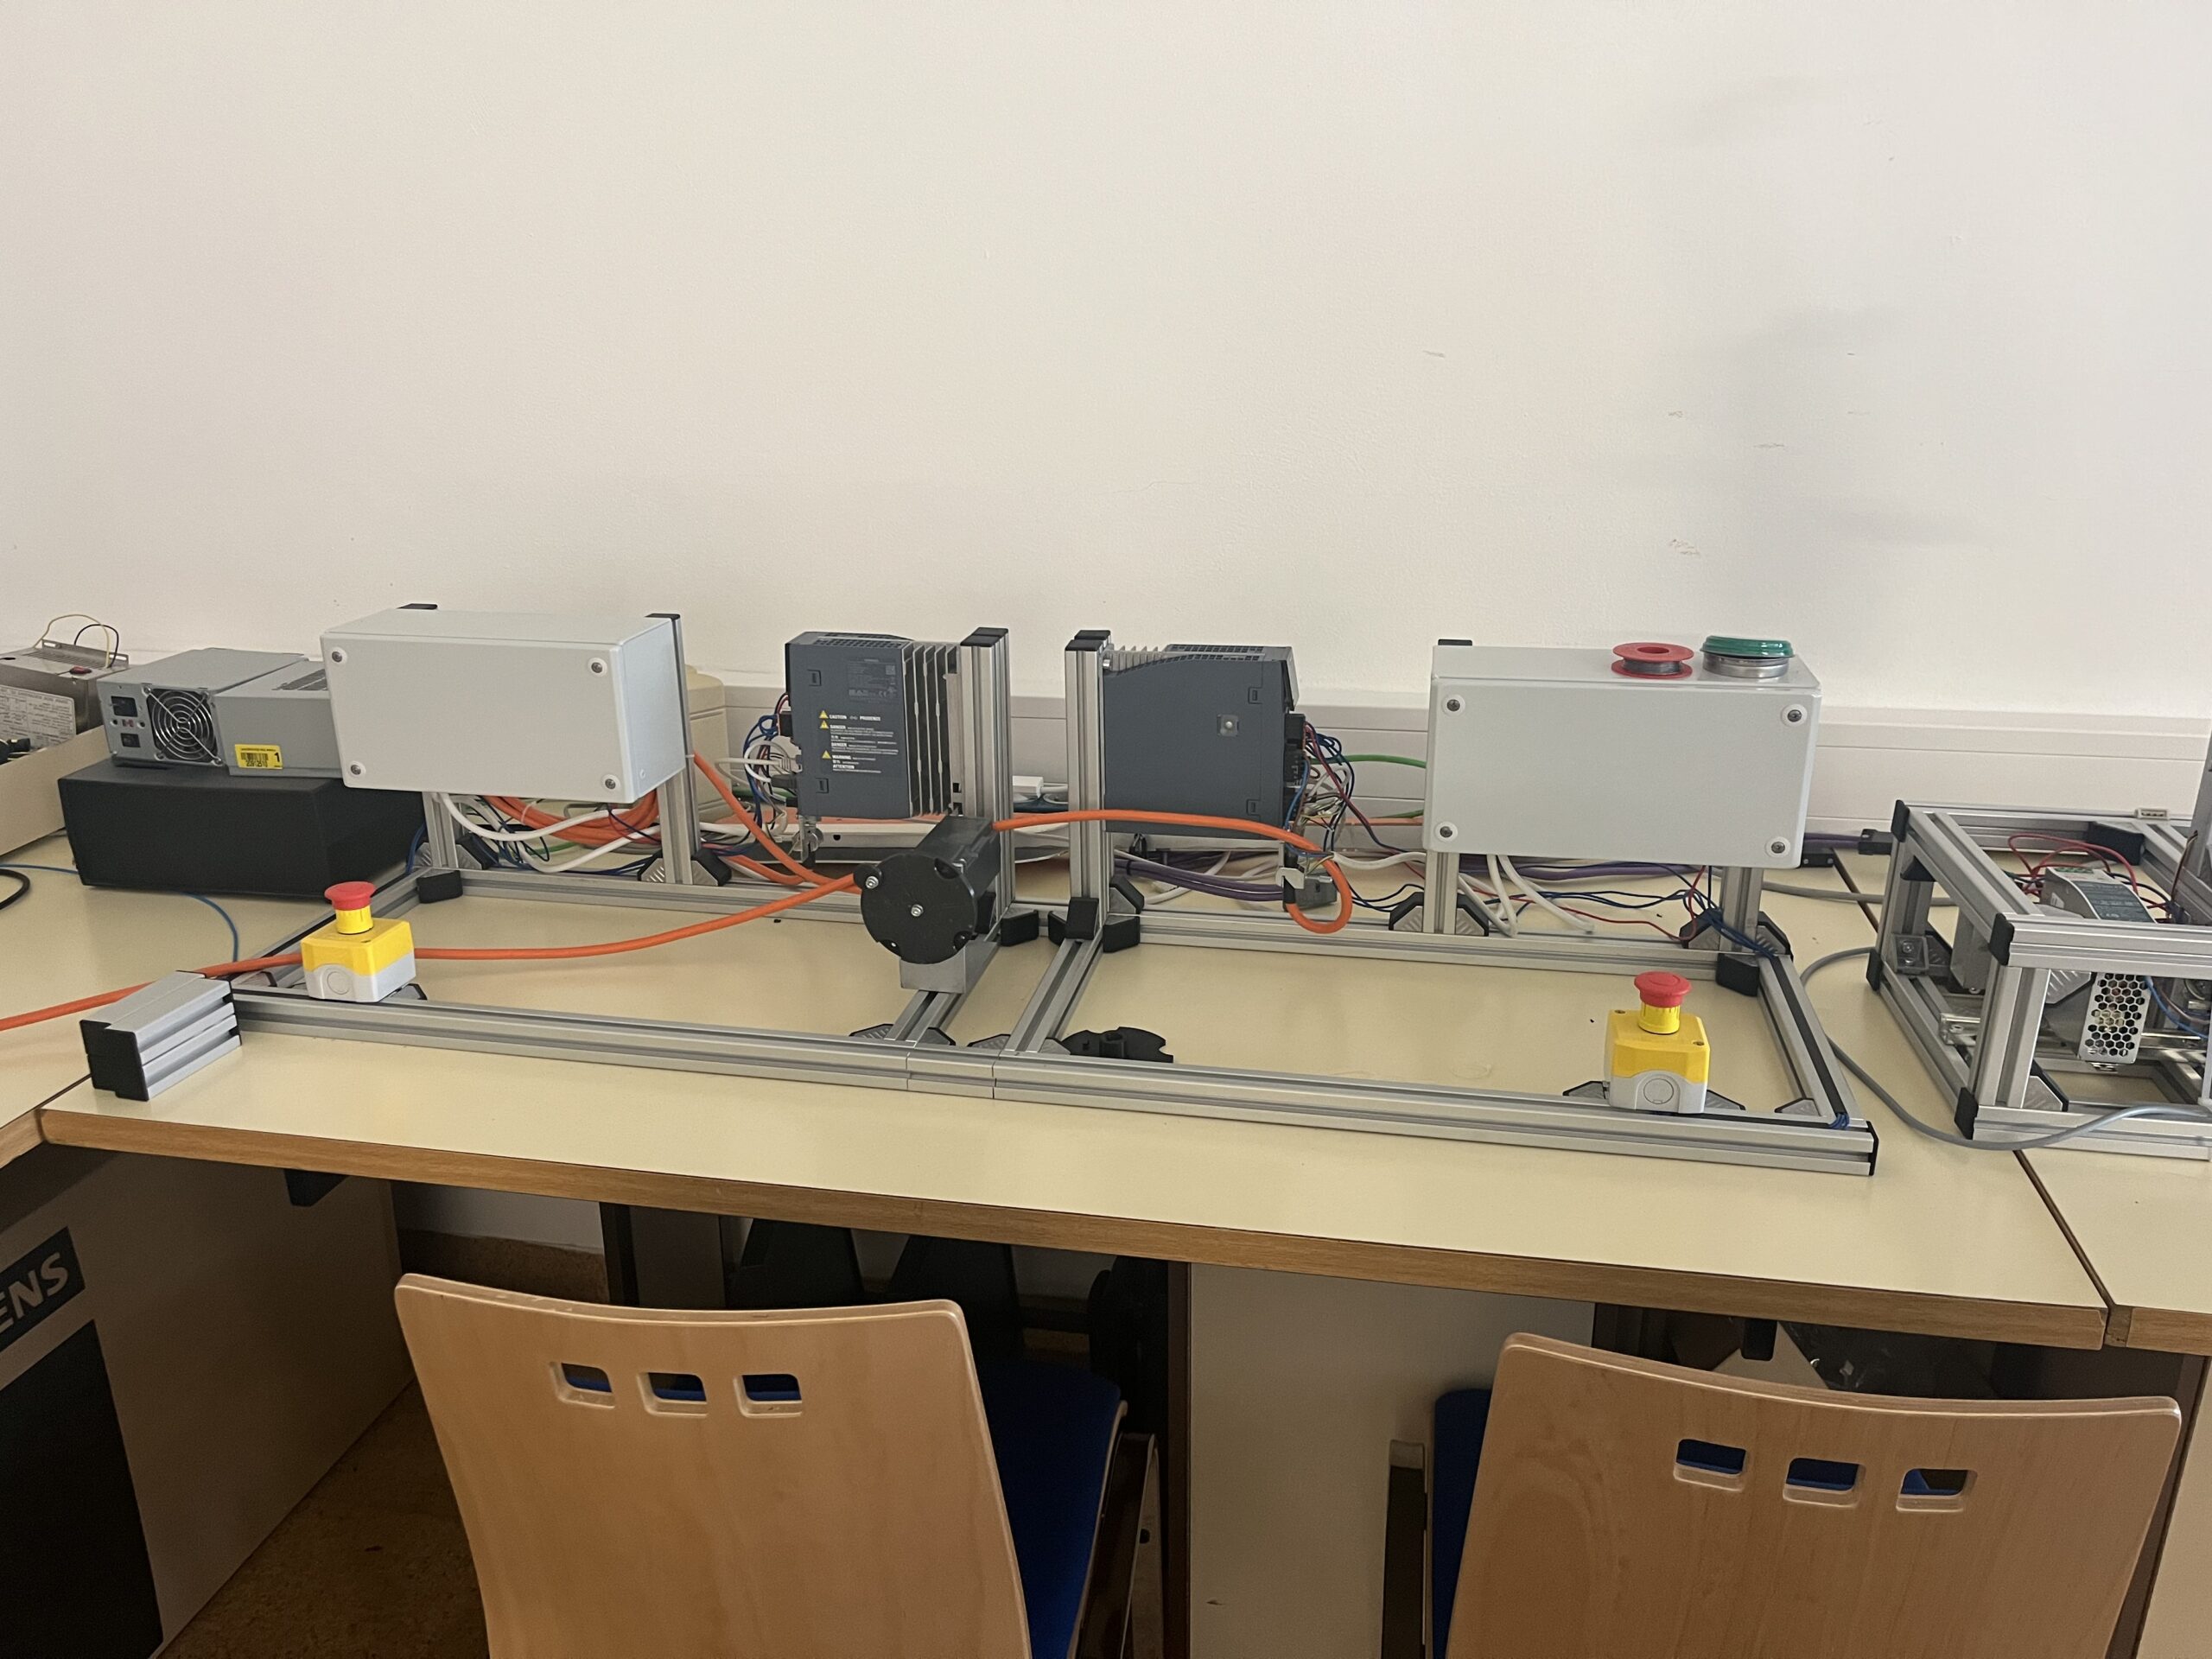
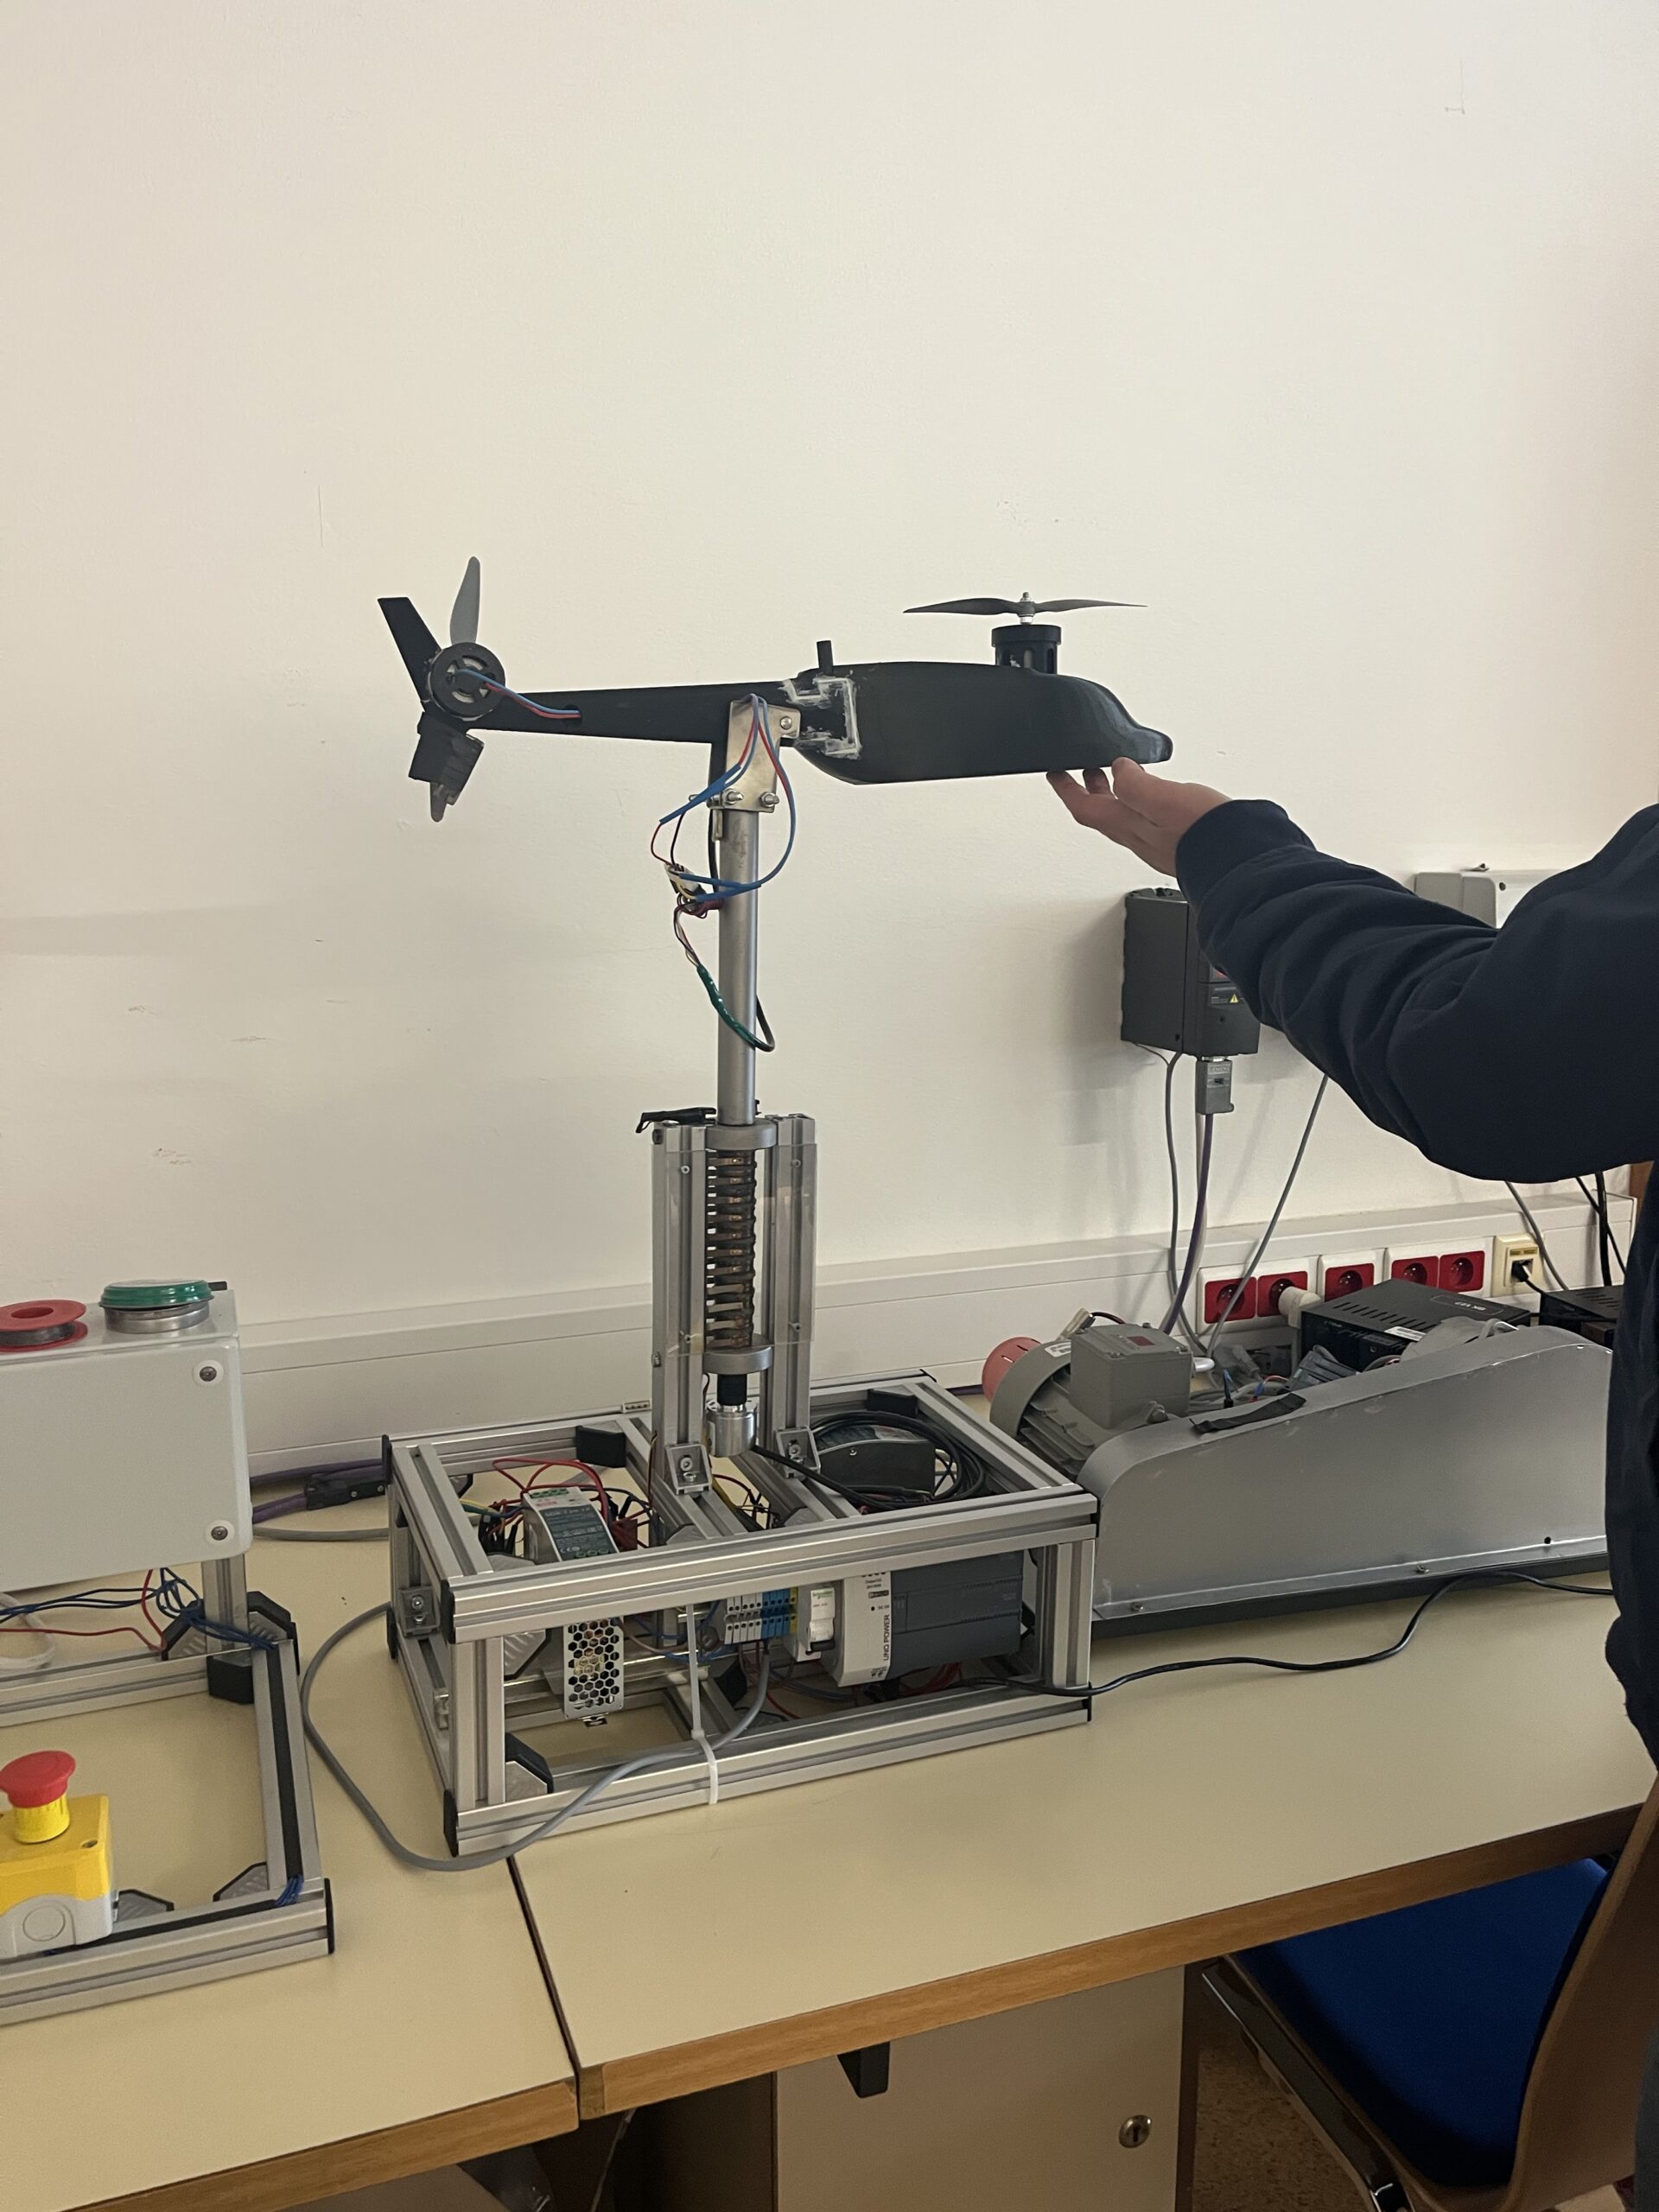
Today, students have access to modern laboratories and technologies, which is undoubtedly a great advantage. The problem, however, lies in the scope of real-world experience. Practical training hours are limited, and there is often a lack of exposure to real projects. As a result, graduates may understand the theory, but lack context and do not see how technology impacts real business. That is why, during the lecture, we showed students the process of OEE implementation. Not an ideal scenario from a presentation, but the real process we deal with in manufacturing companies.

Pilot project as the foundation

We always start implementation in the form of a pilot project, a so-called Proof of Concept (PoC). Its goal is not the immediate deployment of the system across the entire production, but to verify whether we can obtain relevant data from the equipment, whether it has sufficient quality, and whether it makes sense in the context of real operations. At the same time, we verify the technical feasibility of the solution and its initial real benefit on a small scale. It is common for the PoC alone to reveal 10–20% of hidden performance.

Equipment selection and understanding reality

The first step is understanding the existing technology. In practice, you work with machines that are already operating in production, often for many years. This means dealing with older technologies without modern communication, incomplete or outdated documentation, or non-standard modifications made during the machine’s lifecycle.

At the beginning, we focus mainly on two things. On one hand, we need to verify whether it is even possible to obtain the data required for OEE calculation from the equipment. On the other hand, we examine the technical possibilities for connection. We identify the PLC manufacturer, the specific model, available modules, and communication interfaces. Only the combination of these two perspectives – process and technical – determines whether it makes sense to start measuring OEE on a given machine.

Connection and communication in real conditions

Theory talks about protocols such as OPC UA, Modbus, or Profinet. Reality, however, is usually much more complex. You often find that the PLC has no free port, a communication module is missing, or the system was simply not designed for integration with other tools. In such cases, it is necessary to find solutions, from adding hardware to modifying the existing infrastructure.

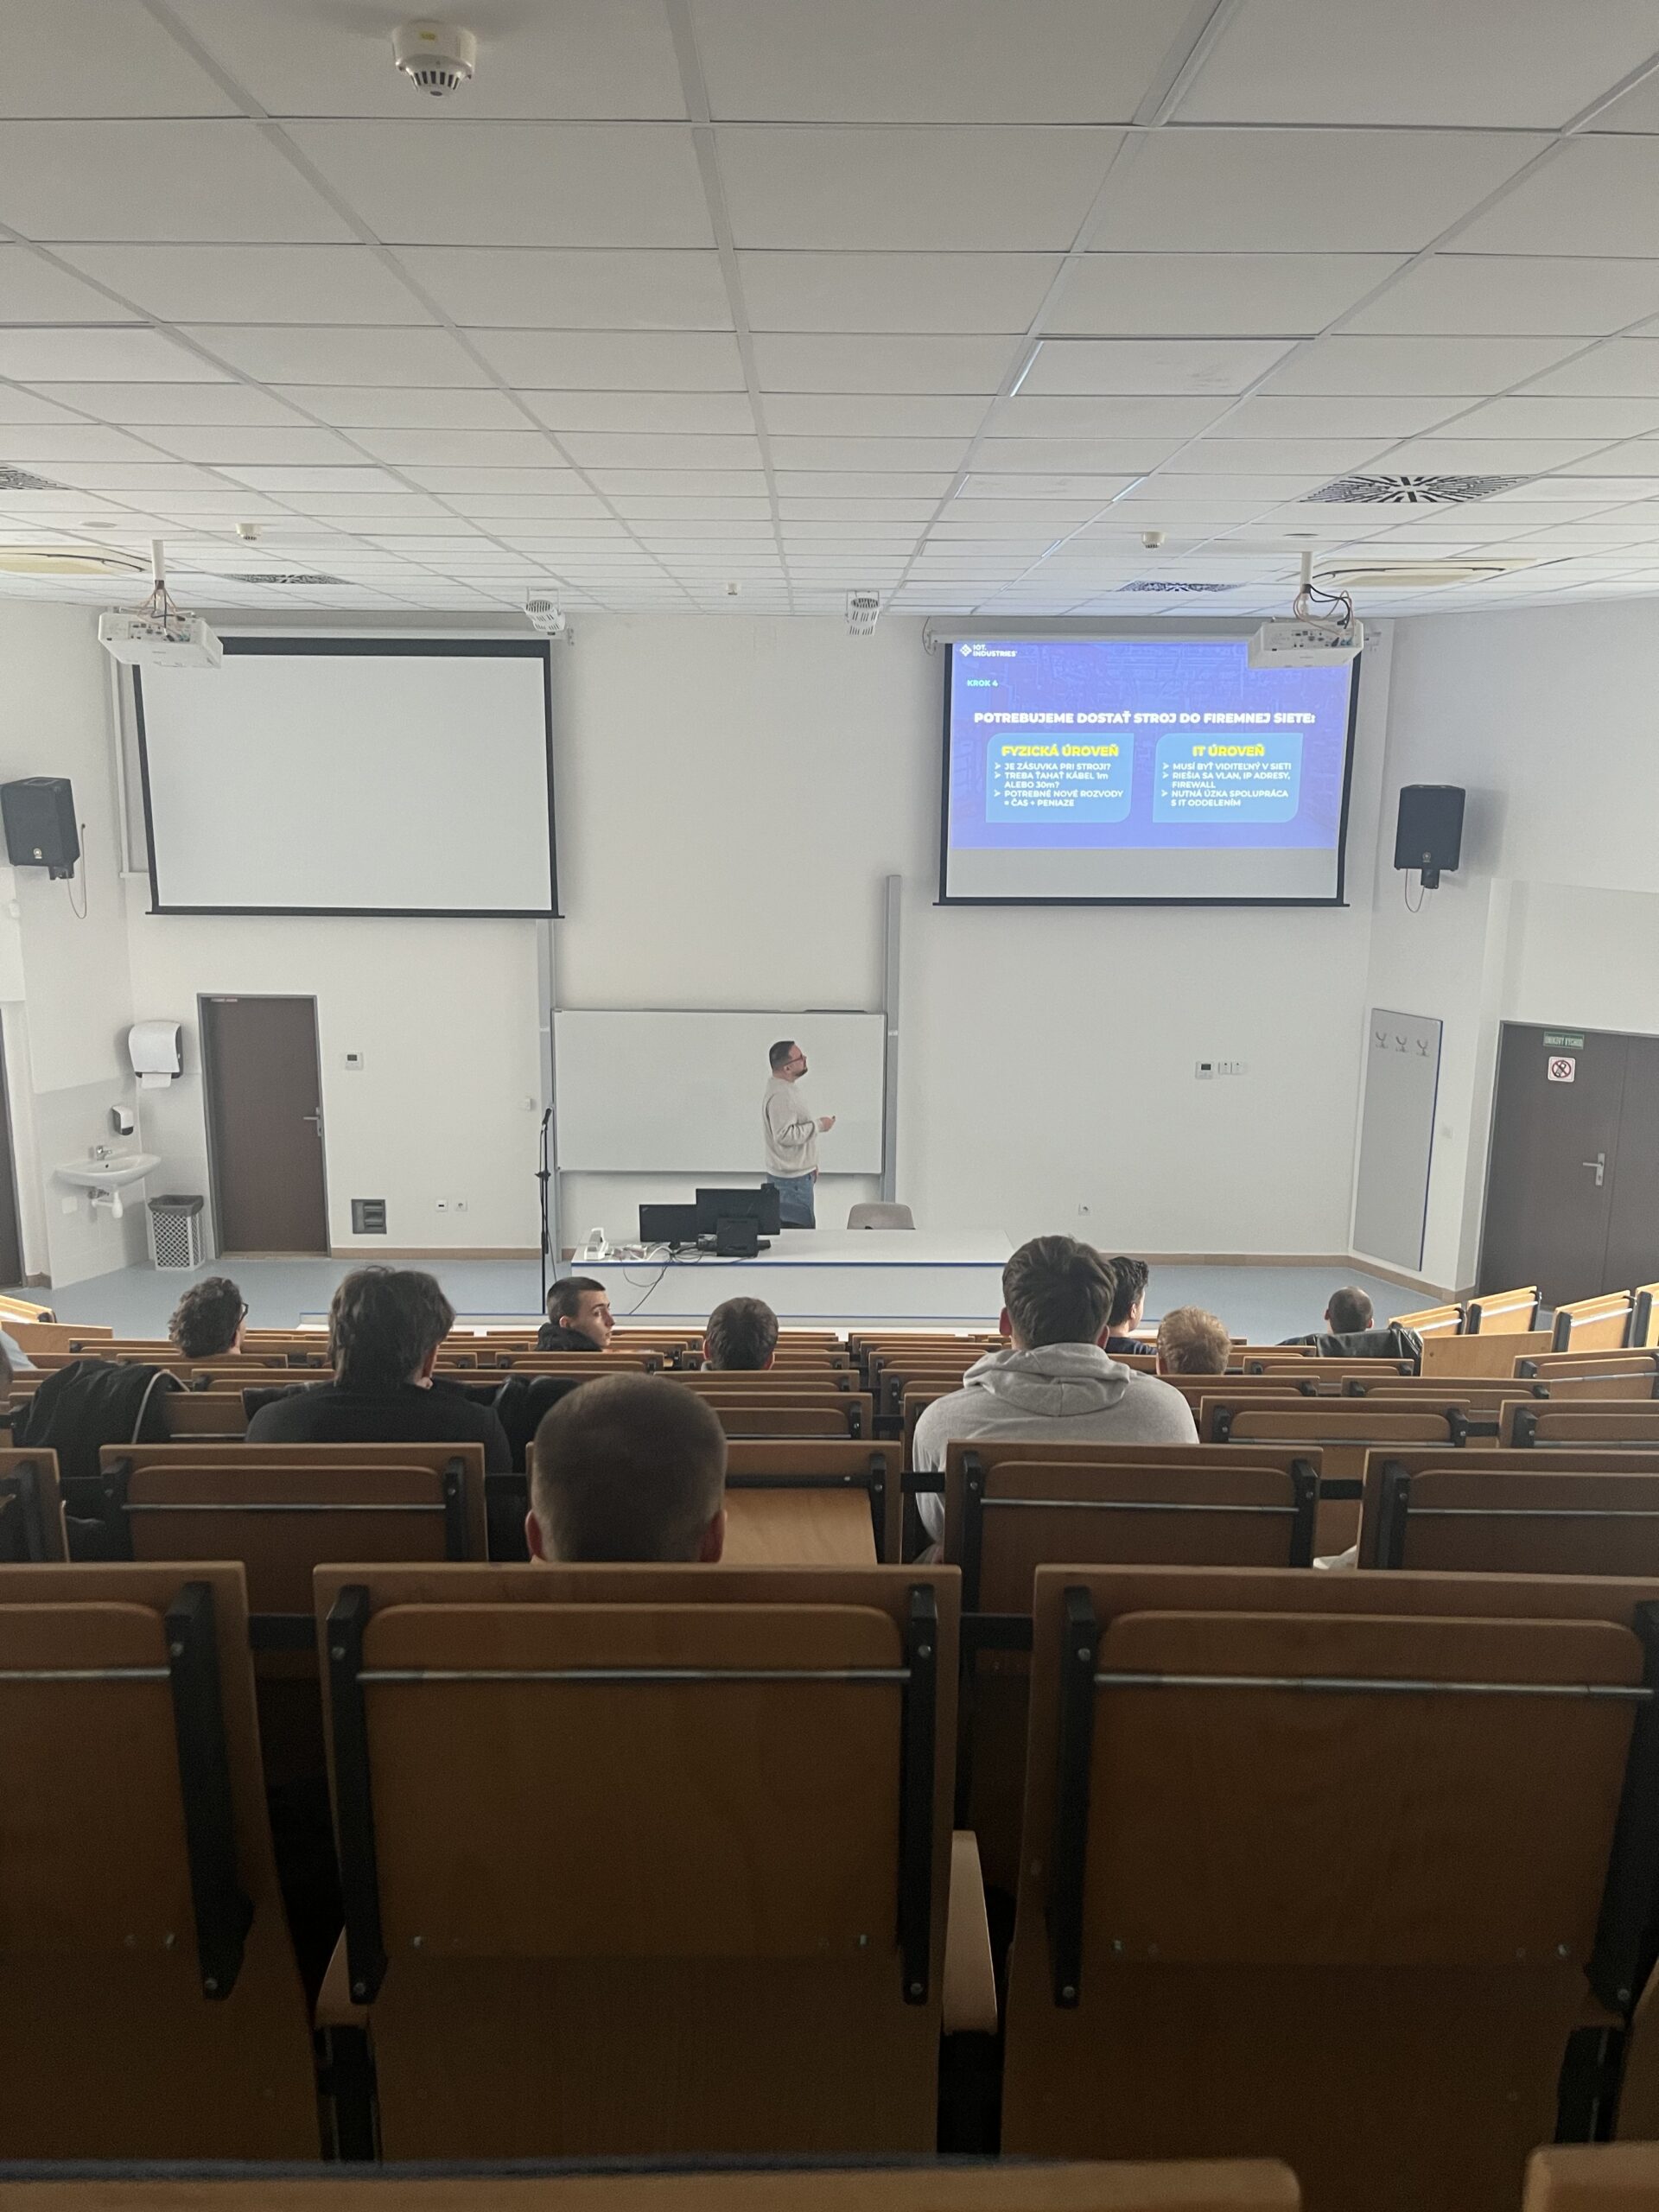
Connecting a machine to the network is therefore not just about physical wiring. We enter an environment where it is necessary to address IP addressing, network segmentation (VLAN), security policies, and firewalls. It is precisely in this phase that the biggest delays often occur, because the project interferes with the existing IT infrastructure and requires coordination with the IT department.

Identification, data collection, and analysis

Documentation will, in most cases, not tell you what individual signals actually mean. Therefore, it is necessary to monitor them in real time, compare them with machine behavior, and gradually understand the logic of their combination. Only through this process can you reliably determine when the machine is actually producing, when a unit is created, and when it is defective.

Once the relevant signals are identified, continuous data collection begins. The data is stored in a database and visualized in real time. At this stage, production becomes “visible” for the first time. What was previously hidden in estimates or paper records turns into accurate and instantly available information.

From data to real solutions

However, data collection is not the goal. It is only the beginning. The real value arises when the company starts actively working with the data. Suddenly, it clearly sees why machines stop, where they slow down, where defects occur, and where unused capacity is hidden.

At this point, systematic work with losses in production comes into play. We most often rely on the Six Big Losses model, which divides losses into six main categories, from failures and downtime, through reduced speed, to production defects. But it is not just about naming these losses. The key is that, thanks to data, you can quantify them precisely, evaluate their impact, and assign a specific elimination target.

Based on this, a natural cycle of improvement is created. First, you identify the biggest problem, then implement a specific measure, track its impact in the data, and repeat the process. Production optimization thus shifts from a one-time initiative to a continuous, data-driven process, not one based on estimates.

Why is a skilled PLC programmer essential?

At the end of the lecture, we returned to the original question: What does a PLC programmer actually do? It is not just programming. It is a professional who understands technology, understands data, and indirectly influences decision-making across the entire company. And this is precisely the perspective that is often missing in education, even though it is crucial in practice. It also confirmed that connecting theory with practice has enormous value for students. Not because they learned something entirely new, but because they started to understand the connections.

The feedback from the university captured this perfectly:

“Connecting theory with practice is extremely important – these kinds of meetings give students a perspective they will not find in textbooks. I am glad they had the opportunity to meet someone who works daily in the field they are studying. Thank you for your time, openness, and inspiring sharing of experience!”
– Mário Michálik

And that is exactly what manufacturing digitalization is about today. Not about the technologies themselves, but about the ability to understand how the different parts of the system are connected – from PLC all the way to strategic decision-making.

Comprehensive solutions from IoT Industries

If you would be interested in a similar lecture or expert knowledge sharing from real practice at your school or organization, we would be happy to get involved. We believe that connecting theory with real projects brings the greatest value – both for students and for the industry itself.

Why Choose IoT/IIoT Implementation with IoT Industries?

Traditional companies typically specialize in OT (operational technologies, such as production lines and devices) or classic enterprise IT systems. However, we are able to connect both of these worlds. Our unique expertise in integrating OT and IT allows us to deliver innovative solutions in digital transformation, enhancing efficiency, reliability, and competitiveness for manufacturing companies.
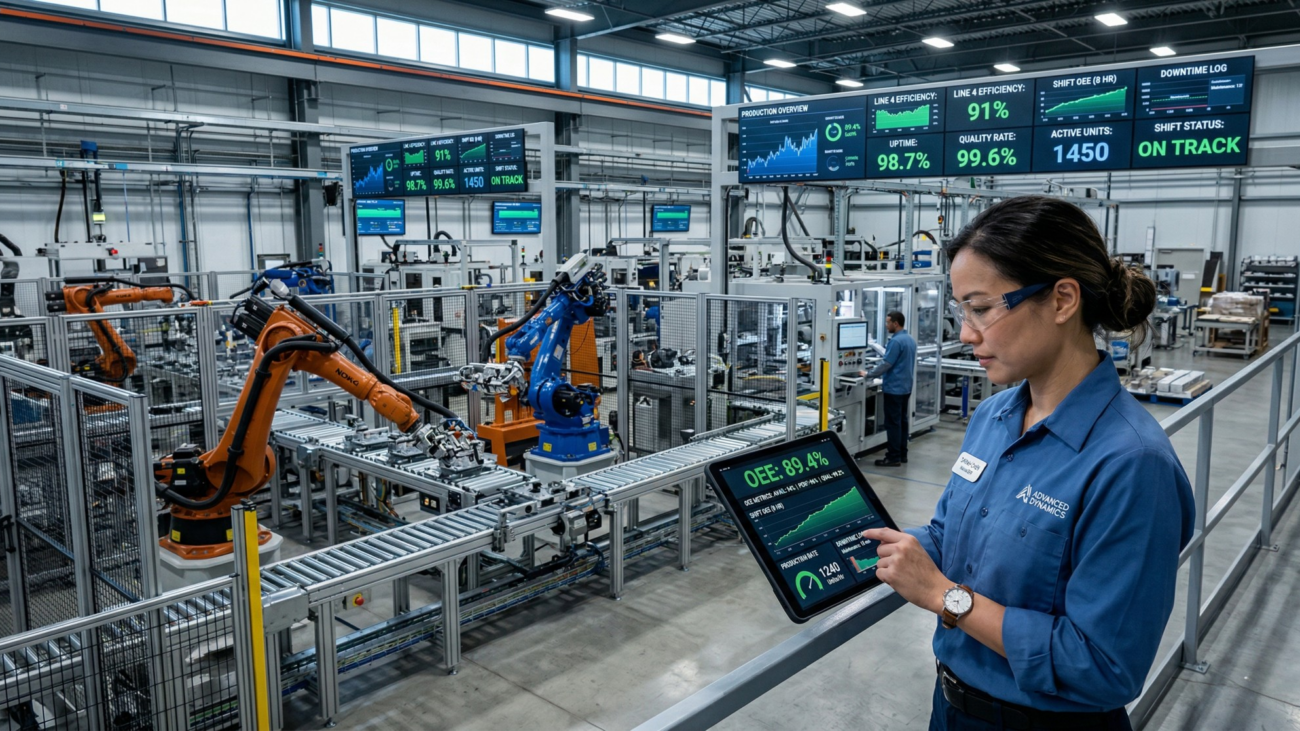
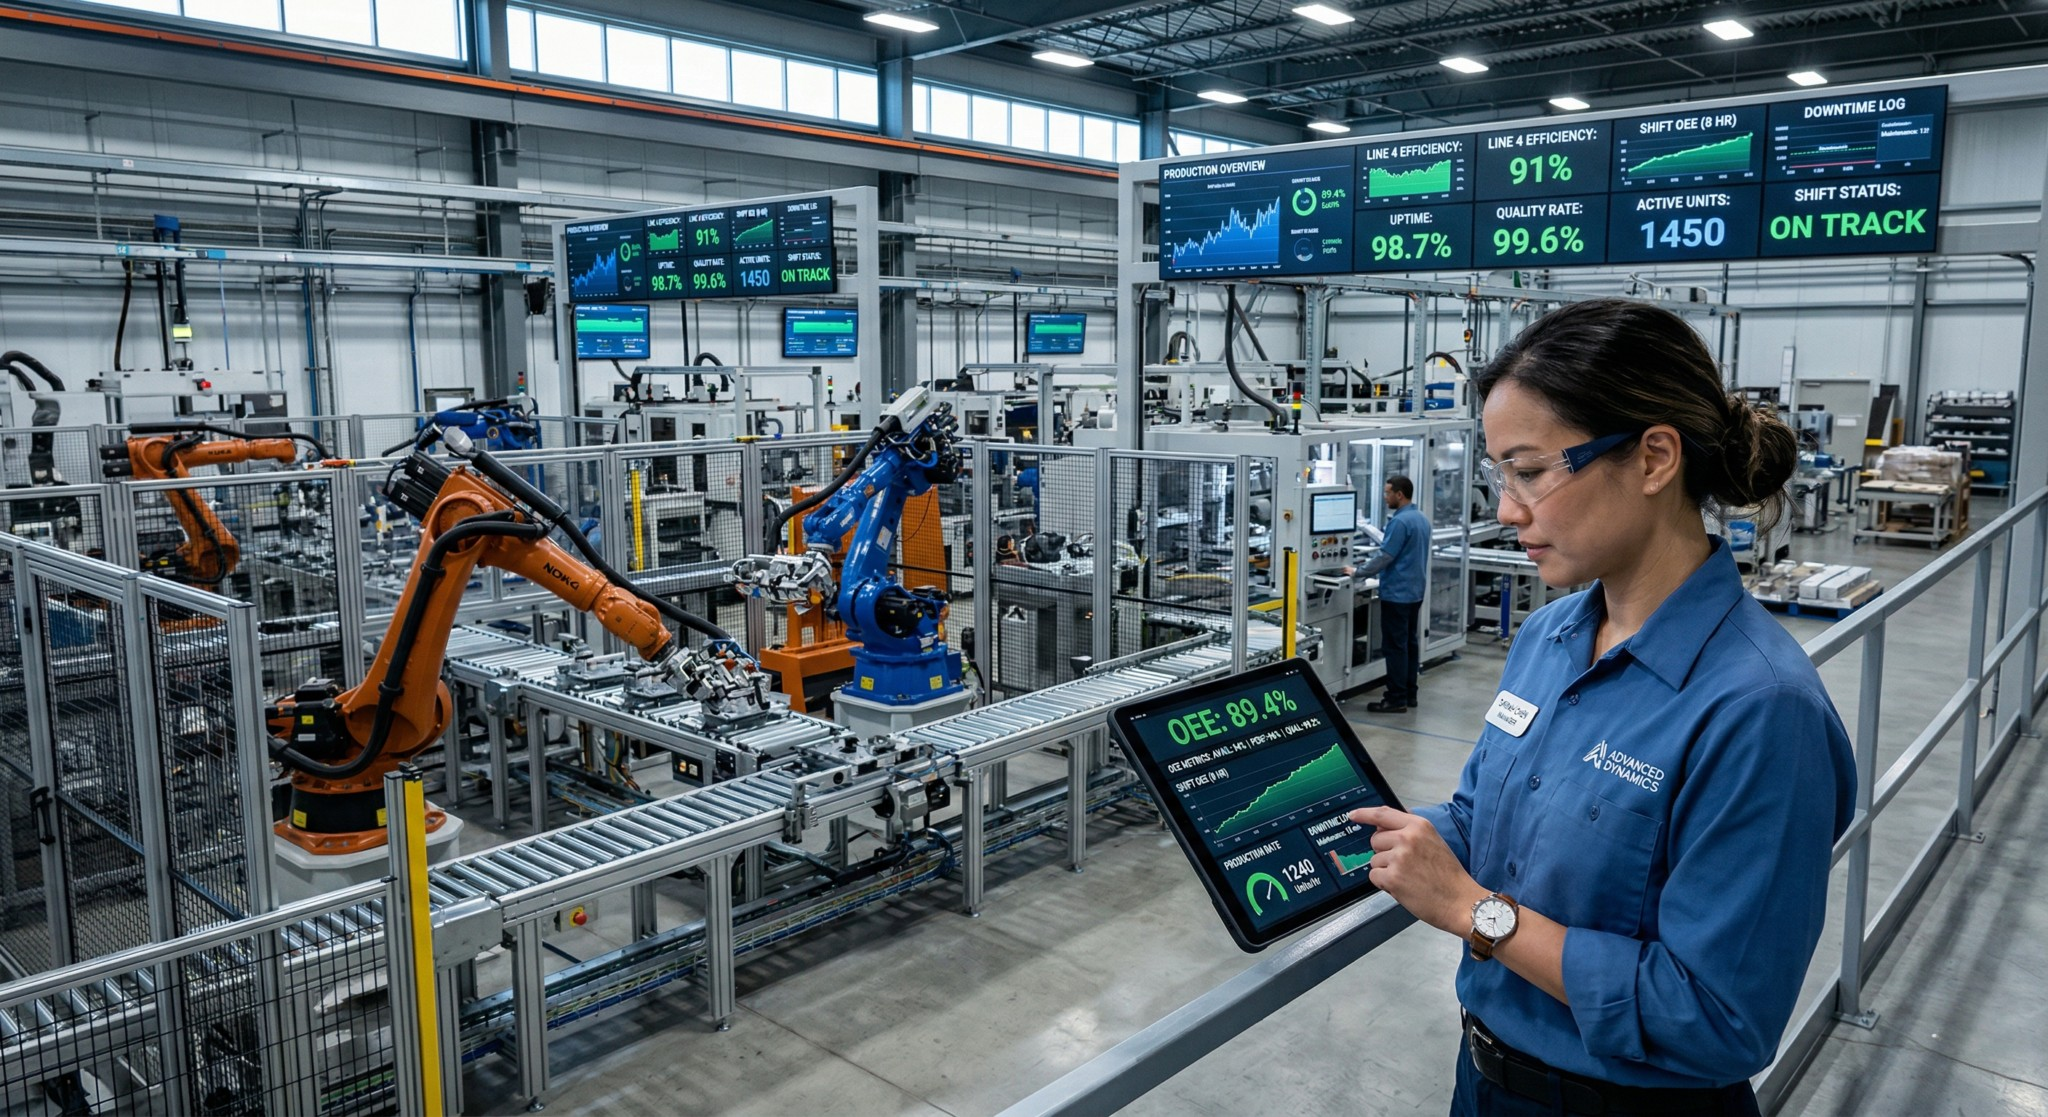
Efektivita práce | Ako ju správne merať, počítať a dlhodobo zvyšovať | Work Efficiency | How to Measure, Calculate, and Continuously Improve It

Work Efficiency | How to Measure, Calculate, and Improve It Long Term

If you manage a manufacturing company, you are probably facing growing pressure from several directions at once. Costs are rising, deadlines are getting shorter, competitors are moving faster, and expectations for results keep increasing. In such a situation, it is only natural that sooner or later you arrive at the question that determines both profitability and the future development of your business: What is the actual work efficiency in your production?

Work efficiency is not a matter of feeling or an abstract concept. It is a measurable variable that can reveal with great accuracy whether you are using your resources to their full potential or whether part of that potential is slipping away without being visible at first glance. And the good news is that efficiency can not only be measured, but also systematically improved. The condition, however, is that you understand it correctly and rely on quality data rather than estimates.

Efektivita práce | Ako ju správne merať, počítať a dlhodobo zvyšovať | Work Efficiency | How to Measure, Calculate, and Continuously Improve It

What is work efficiency and why is it important for a manufacturing company?

Work efficiency expresses how effectively a company can transform available resources into a real result. In other words, it answers the question of how much value you can create from the resources you have available.

That is exactly why this indicator is so important. It does not simply tell you whether “work is being done,” but whether the work is being carried out in a way that makes economic and operational sense. From a management perspective, it is therefore not just an internal performance indicator. It is a direct factor that affects costs, the ability to meet deadlines, and the overall competitiveness of the company.

🔵 Work efficiency – calculation

The basic formula for calculating work efficiency is: Work efficiency = output / input

Output may represent the number of units produced, revenue, or completed tasks.
Input may be time, number of employees, or costs.

At first glance, this is a clear and logical formula that is used quite often. In practice, however, it is one of the most frequently misinterpreted indicators in manufacturing.

Imagine the following situation:

An operator produces 100 units in 8 hours.
After a process adjustment, they produce 120 units in the same amount of time.
According to the simple calculation, efficiency increased by 20%.

But this result says nothing about what is actually happening in the process. It does not take into account whether the machine was producing the whole time or had downtime, whether it was operating at maximum performance, or what portion of the output had real value. It also fails to capture the actual potential of the equipment, that is, whether under ideal conditions it could have produced 160 units instead of 120.

And this is where the biggest problem arises. Work efficiency is very often evaluated without context. And numbers without context are, at best, inaccurate, and at worst, misleading.

What actually affects work efficiency?

If you want to understand work efficiency correctly, it is not enough to see it as a single number. In reality, it is a combination of several factors that together create the overall picture of production performance.

➡️ Actual production time

The first key factor is the time during which production is actually taking place. Not planned time, but the real time when the company is producing value. In reality, almost no production runs continuously. There is downtime, whether planned, such as changeovers or maintenance, or unplanned, caused by failures, waiting for material, or waiting for an operator. Every such interruption means a loss that does not appear at all in a simple efficiency calculation. The result is a situation in which the company appears busy, but in reality produces only during part of the available time.

➡️ Actual performance compared to the ideal

The second factor is actual performance compared to the ideal state. Even when a machine is running, it may not be operating at its maximum potential. It may run more slowly than its technical parameters allow, or its performance may decrease due to wear, incorrect settings, or inefficient operation. This type of loss is especially dangerous because it is not visible at first glance. Production is running, the numbers are growing, but actual performance is falling short of what could be achieved. The difference between actual and ideal performance therefore represents one of the greatest sources of unused potential in manufacturing.

➡️ Output quality

The third factor is output quality. Work efficiency is not only about quantity, but also about how much of the produced volume has real value. If part of the production does not meet requirements, it has to be reworked or scrapped entirely. That means that time, energy, and capacity were indeed used, but did not deliver the expected result. In that case, the production volume may look satisfactory, but actual efficiency declines.

Only the combination of these three factors – actual production time, actual performance, and quality – provides a complete picture of how efficiently production is operating. If even one of them is missing, the resulting number stops reflecting reality and becomes more of an indicative estimate than a reliable basis for decision-making.

How is work efficiency measured in practice?

If we want not only to understand work efficiency, but also to manage it, we must be able to measure it specifically. In practice, however, there is no single universal indicator that fits every company and every situation. Different types of calculations, from simple operational metrics to complex indicators, answer different questions, and each has its own limitations.

👷 Productivity per employee or per hour worked

The most basic approach is measuring labor productivity per employee or per hour worked. It is a simple ratio between output and input that is often used as an initial indicative metric.

Imagine a production operation where five employees produce a total of 2,000 units during an eight-hour shift. In that case, productivity per employee comes to 400 units per shift. If we convert this result into time, we get productivity of approximately 50 units per hour worked.

2,000 units / 5 employees = 400 units per shift
2,000 units / (5 employees × 8 hours) = 50 units per hour worked

This type of calculation is fast, clear, and especially useful where human labor plays the dominant role. Its major disadvantage, however, is that it ignores the technological reality of production. It does not take downtime into account, does not see the difference between slow and optimal equipment performance, and cannot work with output quality. The result is a number that may look precise, but does not speak to the actual efficiency of the process.

💵 Productivity expressed as value created

At a higher level, indicators based on value created are used, such as productivity expressed as value added per employee or per hour worked. This approach is typical especially for economic analyses, where the focus is on how much value a company can create from its available resources.

If a company creates €3,000,000 in value annually and has 60 employees, productivity per employee is €50,000 per year. And if the employees work a total of 96,000 hours, then productivity per hour is €31.25.

€3,000,000 / 60 employees = €50,000 annually per employee
€3,000,000 / 96,000 hours = €31.25 per hour

The difference between productivity per employee and productivity per hour worked is significant. While productivity per employee can be influenced, for example, by organizational structure, productivity per hour worked goes deeper and better reflects actual work performance. That is why it is considered a more accurate indicator. Even these indicators, however, cannot capture the most important thing, namely what is happening directly on the shop floor.

⚙️ OEE as the most practical indicator in manufacturing

In an industrial environment, efficiency is not created only at the level of people, but above all at the level of equipment. And that is precisely why OEE (Overall Equipment Effectiveness), or overall equipment efficiency, is used as a key indicator.

OEE is based on the principle we explained earlier. It tracks three core areas – availability, performance, and quality. These three key factors are combined into a single figure that shows what share of its maximum potential the equipment is actually utilizing.

If, during the shift, the equipment does not run for part of the planned time, its availability decreases. If it runs, but more slowly than its parameters allow, it loses performance. And if it produces defects, quality decreases. Each of these losses is multiplied, which means that even relatively small deviations have a significant impact on the overall result.

Imagine equipment with 85% availability, 90% performance, and 95% quality. At first glance, that looks very good. But the resulting OEE is 73%. That means that more than one quarter of the production potential remains unused.

And that is where the power of OEE lies. Unlike simple calculations, it does not only show the result, but also helps reveal its cause. It makes it possible to precisely identify whether efficiency is declining بسبب downtime, reduced performance, or quality defects. That is why it becomes not only an analytical tool, but above all a practical production management tool.

Why is the calculation alone not enough?

This brings us to the most important point of the entire article. Even the best indicator will not help you if it is based on bad data. The work efficiency calculation itself is only a tool. Its value always depends on the data it is based on. It is often the case that even companies that measure efficiency work with incomplete, delayed, or distorted data. The result is a situation in which even a sophisticated indicator looks trustworthy, but in reality does not reflect the actual state of production.

✅ Quality data as the foundation of real efficiency

If measuring work efficiency is to have real meaning, it must be built on data that is collected directly in production, automatically, accurately, and in real time.

That means three fundamental things. First, data collection must not depend on manual recording, which is naturally prone to errors and delays. Second, data from production, maintenance, warehouse, quality, and sales must be interconnected so that the company works with one version of reality (the so-called Single Source of Truth), not several parallel interpretations. And third, information must be available continuously, not only at the end of the shift or in a weekly report.

This is what creates the difference between estimated efficiency and managed efficiency.

✅ Loss identification

Once you have quality data available, the second key step is to understand where efficiency is actually leaking away. This is what the Six Big Losses model is for, one of the most widely used approaches in modern production management. It divides losses into six main categories and helps identify them precisely.

With the Six Big Losses model, the point is not to memorize all six categories. What matters is understanding the principle. Efficiency is not lost in one major problem. It is lost in dozens of smaller situations that repeat every day. The model helps not only to identify these losses, but also to assign them a specific goal, whether that means eliminating them completely or at least reducing them significantly.

In combination with accurate data, improving efficiency thus stops being a random process and becomes a managed activity. The company knows exactly where losses arise, what their impact is, and which ones make sense to address first.

✅ A continuous process of improving efficiency

But even identifying losses alone is not enough. Data without action has no value. The key is to know how to act based on it, then evaluate the result and act again. In practice, this means that the company not only identifies a problem (for example, frequent downtime), but also implements a specific measure, tracks its impact, and adjusts it based on the result. And this cycle repeats continuously.

Work efficiency is therefore not improved by one single decision, but by a series of small, systematic steps. Every improvement needs to be verified by data. Every decision must have feedback. And it is precisely this cycle – act, evaluate, adjust, and act again – that distinguishes companies that merely monitor efficiency from those that can manage and improve it over the long term.

5 practical steps to higher efficiency

1️⃣ Identify the problem

The first step is not to look for a solution, but to understand the problem. In many companies, there are multiple areas where losses occur, but not all of them have the same impact. That is why it is important to focus on those that affect performance the most. Typically, these are frequent equipment downtime, reduced production line performance, or recurring production errors. The goal is not to analyze everything at once, but to identify one specific area where improvement has the greatest potential.

2️⃣ Start with a pilot project

Instead of trying to change the entire company at once, focus on one line, one machine, or one process. A pilot project allows you to set the right method of collecting and evaluating data, verify the benefits of the solution in real conditions, and identify potential issues before rolling it out further. This step significantly reduces risk while also delivering quick initial results that can convince other parts of the organization.

3️⃣ Set up the data architecture

If data is to have real value, it must be accurate, connected, and available at the right time. In practice, this means automated data collection directly from equipment, integration of production, maintenance, quality, and other systems, and a unified data structure that ensures consistent evaluation. Without this foundation, efficiency may be “measured,” but it will not be possible to manage it reliably.

4️⃣ Launch measurement and evaluation

Data collection is only the beginning. Real value arises only when the data begins to be actively used. At this stage, it is important to regularly monitor key indicators, identify deviations and their causes, and then take specific measures to eliminate them. Every measure should have a clear objective and measurable impact. Only then is it possible to objectively evaluate whether the change delivered the expected result.

5️⃣ Scale the solution

Once the pilot project proves its results, it is time to expand it. At that point, the company already knows what works and what does not, has processes and a data structure in place, and has concrete results on which to build. The solution can then gradually be extended to additional lines, operations, or the entire company.

Comprehensive solutions from IoT Industries

At IoT Industries, we help manufacturing companies go through this entire process – from identifying the biggest losses, through designing a pilot solution, all the way to gradually expanding it across the entire company. If you want to gain a clear overview of where unnecessary losses arise in your production and how to start systematically eliminating them, contact us. We will be happy to show you a concrete approach tailored to your operation.

Why Choose IoT/IIoT Implementation with IoT Industries?

Traditional companies typically specialize in OT (operational technologies, such as production lines and devices) or classic enterprise IT systems. However, we are able to connect both of these worlds. Our unique expertise in integrating OT and IT allows us to deliver innovative solutions in digital transformation, enhancing efficiency, reliability, and competitiveness for manufacturing companies.
Kľúčové trendy v Industry 4.0 – Čo očakávať v roku 2026? | Key Trends in Industry 4.0 – What to Expect in 2026?

Key Trends in Industry 4.0 – What to Expect in 2026?

If you manage a manufacturing company, 2026 probably did not start very calmly for you. The pressure on efficiency is higher than ever before. Energy prices are no longer the shock they were two years ago, but geopolitical uncertainty, trade measures, and tensions in global markets are making planning increasingly difficult. At the same time, the responsibility for results still rests on you.

In such an environment, it may seem that the best strategy is to wait. To be conservative. Not to invest. However, it is precisely in times of uncertainty that it becomes clear who will maintain competitiveness and who will begin to fall behind. If you want to know which Industry 4.0 trends will bring real value in 2026 and which are just marketing noise, read on.

Kľúčové trendy v Industry 4.0 – Čo očakávať v roku 2026? | Key Trends in Industry 4.0 – What to Expect in 2026?

Why Is Tracking Industry 4.0 Trends Especially Important Today?

Companies that follow modern trends and the real possibilities of their application do not operate more efficiently because they want to appear “innovative.” They operate more efficiently because they can identify opportunities earlier where time can be saved, costs reduced, or performance increased—without immediately having to invest in new machines or expand production capacity.

An example is the use of artificial intelligence in procurement processes. Today, systems can easily contact 15 suppliers, summarize price offers, and prepare a comparison. What once took a person days can now be completed by a system within hours.

Without monitoring trends, you would arrive at such efficiency improvements five years later, most likely at a time when it has already become the market standard and you are simply catching up. And this is not some futuristic scenario. It is a practical acceleration of processes that reduces administrative burden and frees up people’s capacity for more valuable tasks.

A very similar situation can be seen in manufacturing digitalization. Companies that build a solid data foundation will be able to respond more quickly to market fluctuations, optimize capacities, and make decisions with lower risk. On the other hand, those that follow trends only passively will be implementing in a few years what their competitors are already using as a standard today.

What Challenges Will Companies Face in 2026?

1️⃣ Geopolitical Uncertainty and Difficult Predictability

The year 2026 is characterized by a high level of unpredictability. Threats of trade restrictions, sudden tariff changes, and tensions between global players can have an immediate impact on supply chains, input costs, and material availability. In a highly globalized environment, a single geopolitical decision can affect the entire market.

For many companies, success may simply mean maintaining the status quo. Not in the sense of stagnation, but in terms of stability. Maintaining margins, performance, and delivery reliability despite external shocks. And it is precisely the companies that have a clear overview of their capacities, efficiency, energy consumption, and bottlenecks that can respond to market fluctuations without panic.

2️⃣ Pressure for Flexibility and Rapid Adaptation

In the past, it was possible to plan production months in advance. Today, the situation is different. Orders fluctuate, customers change priorities, delivery times are shortening, and input prices can change practically overnight. What was true last quarter may no longer apply today. Companies therefore need to be prepared to quickly adjust production capacity, redirect production, or optimize costs.

Such flexibility, however, does not emerge from improvisation. It emerges when you have a clear overview of the real utilization of machines, where downtime occurs, and where hidden reserves exist. A company without data reacts reactively, solving problems only after they arise. A data-driven company, on the other hand, can act preventively, before the problem affects results.

3️⃣ ESG, Energy Efficiency, and Regulation

ESG is no longer just a topic for large multinational corporations. Increasingly, it also affects medium-sized manufacturing companies, either directly through legislation or indirectly through the requirements of customers and partners. If a company wants to comply with standards such as ISO 50001, it must be able to systematically monitor energy consumption at the level of individual devices, evaluate energy efficiency, implement specific measures, and demonstrate their benefits.

In 2026, however, ESG is not just a “reputational” topic. Energy represents a significant cost component. Yet many companies still cannot say exactly which machine consumes the most energy, where unnecessary peaks occur, or what the relationship is between production performance and energy consumption. Without this data, energy management is only an estimate. A company that does not have energy under control also does not have a significant part of its margin under control.

What Risks Do Companies Face If They Neglect Innovation?

A company that changes nothing today may feel stable. After all, machines are running, people are working, and orders are being fulfilled. At first glance, nothing dramatic seems to be happening. The problem is that the loss of competitiveness does not happen suddenly, but gradually. First, costs increase by a few percent. Then delivery times become longer. Later, margins decrease. Eventually, it becomes clear that competitors can produce cheaper, faster, or more flexibly.

Companies that fail to innovate systematically therefore risk:

Greater risk, because in times of crisis, reserves are often what determine survival.
Low ability to respond to market fluctuations, where improvisation replaces real adaptation.
Higher invisible losses, as operating costs increase without companies even realizing it.

One thing is important, however: It is never too late to start. Not all innovations require major investments. Often, it is about systematic work with data, identifying hidden reserves, and gradually improving processes. And perhaps in times of an unpredictable market, focusing on efficiency improvements is wiser than waiting for “a better time.” Because a data-driven company handles uncertainty much more calmly.

Key Industry 4.0 Trends in 2026

👉 1. Automated Data Collection

Manually recording data on paper or in Excel should no longer be the norm today. Digitalization is not new, nor is it rocket science. It is the foundation of efficient management. If a company has not started yet, in 2026 it is high time to map processes, define priorities, and most importantly appoint an internal digitalization ambassador.

👉 2. OEE (Overall Equipment Effectiveness)

If digitalization is the foundation, OEE is the next logical step. The OEE indicator can reveal hidden reserves of 20–30%. And honestly, no AI will deliver such an immediate impact. However, beware of a common misconception: the fact that your machine shows OEE on its display does not mean you are digitalized. If these data remain isolated and are not connected to reporting, you are still operating “on paper.”

👉 3. Energy Efficiency Through EMS and BMS Systems

Energy management is no longer just a “nice to have.” Systems such as EMS and BMS allow companies to monitor consumption at the level of individual machines, optimize operations based on tariffs, identify inefficient equipment, and also prepare operations for ISO 50001.

👉 4. Transition from Reactive to Predictive Maintenance

Reactive maintenance (“we fix it when it breaks”) is today a costly luxury. Transitioning to predictive maintenance means collecting operational data, analyzing trends, and most importantly planning interventions before a failure occurs. Combined with a CMMS system, this creates a managed maintenance ecosystem that reduces downtime, emergency interventions, and the secondary damage associated with them.

👉 5. Unified Platforms (Ignition)

There is no need to discard existing systems. However, if a company is starting from scratch, it is wise to choose a platform that can scale. Ignition is an example of a solution that connects all critical systems, enables ETL processes, and simplifies data integration. A unified platform reduces chaos and increases the clarity of data flows.

👉 6. Digital Workforce and High Performance HMI

This topic is discussed far less than it deserves, yet its impact in practice is enormous. The ISA-101 standard defines High Performance HMI principles such as fewer colors, more context, highlighting only critical states—all designed to reduce the cognitive load on operators. A modern interface should not be about 3D graphics and blinking flames, but about the operator making fast and correct decisions.

👉 7. Cybersecurity as an Inherent Part of Projects

The question today is no longer: “Will a company become a target of an attack?” but rather: “When will it become a target?” Cybersecurity therefore must be an inherent part of every project, just as natural as occupational safety, without compromise. Not as a separate add-on, but as a fundamental architectural layer of the solution.

👉 8. Big Data and Advanced Analytics

Big Data only make sense when a company is fully digitalized, the data are reliable, and the processes work properly. At that point, connecting data with AI can bring an additional 2–3% optimization. However, as we described in the article How Big Data Helps Reduce Costs and Boost Performance in Manufacturing Enterprises, advanced analytics is an extension, not a replacement for fundamental digitalization.

👉 9. AI as a Tool, Not a Goal

Artificial intelligence is currently experiencing enormous hype, perhaps even greater than Big Data once did. It is clear that AI is here to stay and will have its place in industry. However, at the moment it is often overestimated and applied in situations where it does not deliver real value.

Companies should not start with the question “How do we implement AI?”, but rather “What problem do we want to solve?”. And the solution does not automatically have to be artificial intelligence. Often, automated data collection and basic process digitalization are enough. The real value lies in the correct and justified use of technology, not in the technology itself.

How to Prepare for These Trends?

If digitalization or innovation is to be successful, it cannot be random or driven only by current trends. It requires a clear structure, realistic expectations, and a process that minimizes risk while maximizing benefits. A properly designed approach also ensures that the investment will not become a one-time project, but rather a long-term tool for optimization.

A proven approach therefore looks as follows:

  • 1️⃣ Audit and process mapping
  • 2️⃣ Identification of priorities and benefits
  • 3️⃣ Solution design
  • 4️⃣ PoC (Proof of Concept)
  • 5️⃣ Implementation
  • 6️⃣ Long-term monitoring and optimization

When deciding on innovations, the greatest challenge is often to objectively evaluate one’s own processes. Internal teams are naturally immersed in daily operations, and many inefficiencies gradually become the “norm” that no one questions anymore. That is why it is beneficial to involve an external partner with practical experience, who can bring an independent perspective, reduce the risk of incorrect decisions, and accelerate the path to measurable results.

Even 2026 Cannot Stop Progress

Market uncertainty should not be a reason for stagnation. On the contrary, it is an impulse to focus on areas that increase flexibility and efficiency. Digital transformation is not a trend for show. It is a tool that enables companies to respond to unexpected situations faster than their competitors. If you want to find out where the greatest potential lies within your production, let’s start with a non-binding consultation.

“We may not know what global politics will bring. We may not know how markets will evolve. But one thing is certain. The world will not stop. Companies may decide to be more conservative, yet there is still room for innovations that deliver real value.” – Matej Medvecký, Founder & Technical Lead, IoT Industries Slovakia

Why Choose IoT/IIoT Implementation with IoT Industries?

Traditional companies typically specialize in OT (operational technologies, such as production lines and devices) or classic enterprise IT systems. However, we are able to connect both of these worlds. Our unique expertise in integrating OT and IT allows us to deliver innovative solutions in digital transformation, enhancing efficiency, reliability, and competitiveness for manufacturing companies.
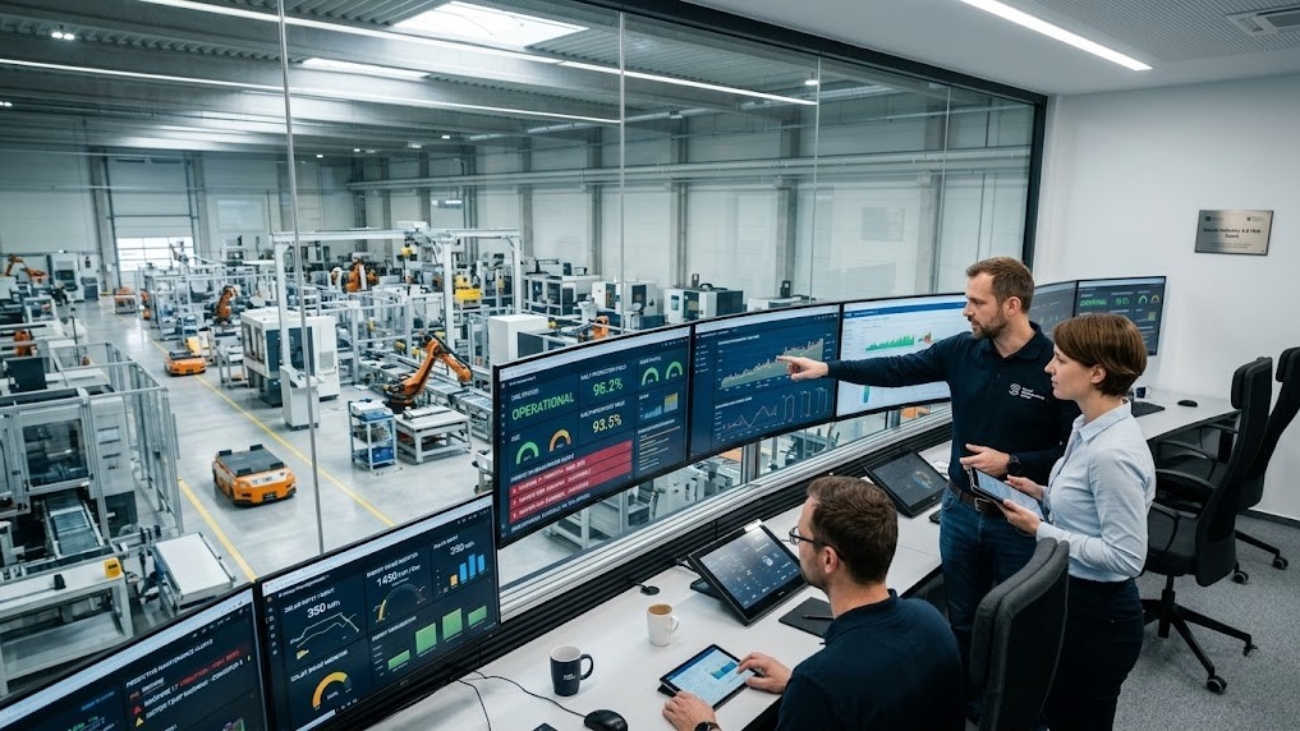
Optimalizácia nákladov vo výrobných podnikoch vďaka digitálnej transformácii | Cost optimization in manufacturing companies thanks to digital transformation

Cost Optimization in Manufacturing Through Digital Transformation

With the rising costs of materials, labor, and energy, cost optimization has become a matter of survival for manufacturing companies. It is no longer enough to cut costs by reducing staff, limiting overtime, or postponing investments. The key to sustainable savings lies in digital transformation — enabling companies to make better use of existing resources, uncover hidden inefficiencies, and turn them into measurable savings.

However, success doesn’t come from a single tool. It’s achieved by connecting the entire infrastructure — from data collection (MES), through production monitoring and control (SCADA), performance tracking (OEE), predictive maintenance (PdM), energy and building management (EMS/BMS), all the way to data processing and reporting (BI).

Optimalizácia nákladov vo výrobných podnikoch vďaka digitálnej transformácii | Cost optimization in manufacturing companies thanks to digital transformation

Why Traditional Cost-Saving Methods Are No Longer Enough

Conventional cost-cutting approaches — such as reducing staff, limiting overtime, or postponing investments — deliver only short-term results and often weaken a company’s competitiveness. These methods don’t address the root causes of high costs; they merely mask the problem temporarily.

Digital transformation, on the other hand, enables companies to identify and eliminate hidden inefficiencies directly within their production processes — from inaccurate planning and unnecessary downtime to excessive energy consumption. With modern systems in place, management gains a precise, real-time overview of production and can make informed decisions that lead to sustainable cost reductions and improved competitiveness.

Where Do Hidden Costs Lurk in Manufacturing?

💸 Without digitalized production processes, companies rely on manual data collection and paper-based planning. This leads to inefficient production management, delayed orders, or — on the other hand — excessive inventory levels.

💸 When remote control and real-time monitoring of equipment are missing, downtimes last longer than necessary. Without historical data, it’s also impossible to analyze the causes of failures and prevent them in the future.

💸 Without tracking machine availability, performance, and quality, companies lose the ability to identify bottlenecks and inefficiencies. As a result, machines operate below their potential, overall productivity drops, and costs rise.

💸 Without predictive maintenance, problems are only addressed after a breakdown occurs. Reactive maintenance means longer downtimes, more expensive repairs, and unplanned costs that could have been easily avoided.

💸 Without systematic monitoring of energy consumption and building systems, companies use more resources than necessary. Without optimization, energy bills rise — and the company risks failing to meet legislative or environmental requirements.

💸 Without proper data analysis and reporting, management makes critical decisions based on inaccurate or delayed information. The result: poor cost optimization, lower productivity, and a weakened competitive position.

What Does Cost Optimization Through Digital Transformation Look Like?

💰 MES (Manufacturing Execution System) connects automated production planning with real-time shop floor activity. It reduces costs by eliminating manual data entry, improving resource utilization, and preventing overproduction or delays.

💰 SCADA (Supervisory Control and Data Acquisition) enables real-time monitoring of production equipment and immediate response to deviations or failures. Historical data storage helps uncover root causes of problems and prevent them from recurring.

💰 OEE (Overall Equipment Effectiveness) measures the availability, performance, and quality of machines. It often reveals that equipment operates at only 50–60% of its actual potential. By increasing OEE, companies can achieve savings comparable to investing in new machinery.

💰 Reactive maintenance is costly and causes unnecessary downtime. In contrast, PdM (Predictive Maintenance) uses sensors and analytics to forecast failures before they occur. This lowers maintenance costs, extends equipment lifespan, and increases production reliability.

💰 EMS (Energy Management System) and BMS (Building Management System) monitor and control energy consumption and building operations in real time. They help reduce energy bills and operating costs while supporting compliance with environmental and regulatory standards.

💰 Business Intelligence (BI) acts as the layer that ties all systems together. It collects, analyzes, and visualizes data, giving management clear answers to key questions: Where do the biggest losses occur? Where can costs be optimized? Which measures bring the greatest savings?

Cost optimization doesn’t always mean budget cuts. It often means uncovering and eliminating inefficiencies, waste, and downtime. But this is only possible when a company works with accurate data and reliable tools. If you want to reduce costs, increase productivity, and prepare your business for Industry 4.0, the path forward lies in digital transformation.

Comprehensive Tailor-Made Solution from IoT Industries

At IoT Industries, we’ll help you every step of the way — from designing your data architecture, integrating systems, and connecting technologies to creating custom interactive dashboards tailored to your operations.
Contact us and discover how modern digital solutions can save your company tens of thousands of euros every year.

Why Choose IoT/IIoT Implementation with IoT Industries?

Traditional companies typically specialize in OT (operational technologies, such as production lines and devices) or classic enterprise IT systems. However, we are able to connect both of these worlds. Our unique expertise in integrating OT and IT allows us to deliver innovative solutions in digital transformation, enhancing efficiency, reliability, and competitiveness for manufacturing companies.
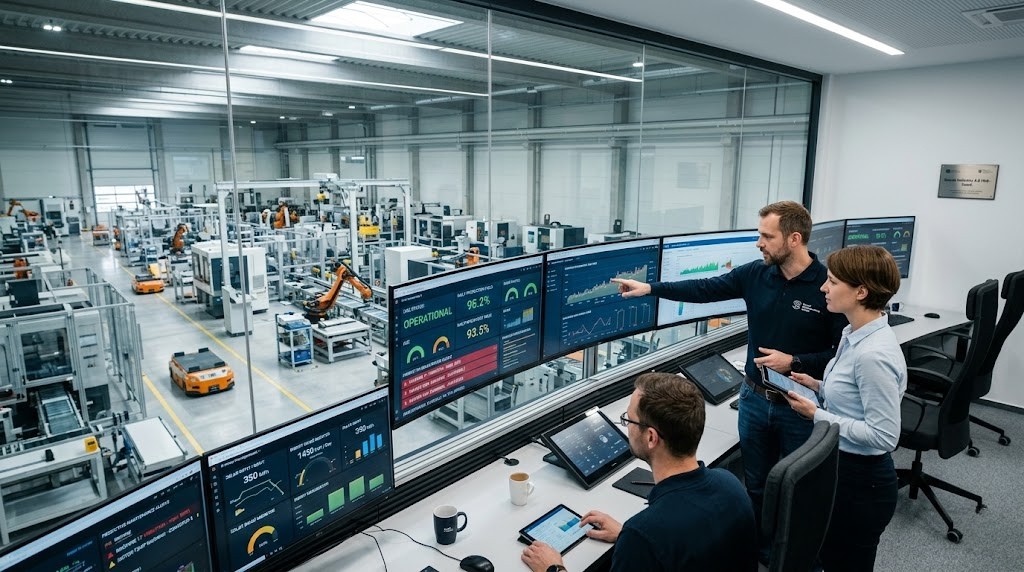
Produktivita práce pod lupou 🔎 Odhaľte skryté straty vo vašej výrobe | Productivity Under the Microscope 🔎 Uncover Hidden Losses in Your Production

Productivity Under the Microscope 🔎 Uncover Hidden Losses in Your Production

At first glance, everything seems to be working as it should. Machines are running, people are working, orders are being fulfilled. You might feel that you’re already getting the most out of your available capacities—that this is the maximum your operation can deliver. But this is often where the greatest potential lies hidden.

Many companies today operate under the impression that they’re running at full capacity, while in reality, they may be losing tens of percent of their true potential. Losses hidden in minor downtimes, underutilized resources, or inefficient processes often go unnoticed because they aren’t visible at first glance. This is why labor productivity is crucial—not as an abstract concept, but as a concrete metric that shows where real improvements are possible.

Produktivita práce pod lupou 🔎 Odhaľte skryté straty vo vašej výrobe | Productivity Under the Microscope 🔎 Uncover Hidden Losses in Your Production

What is labor productivity and why should you start measuring it?

Labor productivity shows how much value your company can create in a given period. Whether it’s the number of units produced, completed orders, or the volume of services delivered, it always answers the same essential question: What is the output compared to the time, people, and technology required?

That’s why productivity is one of the most important indicators of efficiency. If it’s low, the company must invest more energy, time, and money to achieve the same result, which translates into higher costs, lower competitiveness, and weaker business outcomes. On the other hand, increasing productivity allows you to achieve more with what you already have—without unnecessary investment in new machines or the need to hire more people.

There are various ways to measure productivity. These include metrics such as GDP per employee, GDP per hour worked, output per worker, or machine utilization efficiency (OEE). The right metric depends on the type of production and the goals you aim to achieve.

Since proper measurement is the foundation of all improvement, we’ll cover this topic in more detail in a dedicated article, “How to Calculate Labor Productivity.”

Labor productivity in the EU and Slovakia

Looking at the numbers, Slovakia has long lagged behind the EU average in terms of labor productivity. According to Eurostat, the Slovak economy reaches only about 70 to 80% of the average labor productivity in the EU. This means the average Slovak worker produces less value per hour than their counterpart in Western Europe.

For manufacturing companies, this is not only a warning sign but also a huge opportunity. The productivity gap isn’t necessarily due to a lower quality workforce. More often, it’s the result of insufficient use of technology, a lack of automation, poor production planning, or missing reliable data for decision-making. Simply put, Slovak firms often work more, but achieve less.

Common problems in companies that don’t measure productivity

If a company doesn’t measure labor productivity or relies only on estimates, the same scenario tends to repeat itself. Production may be running, but results don’t match the effort. Everything might look fine on the surface, but beneath that, small inefficiencies accumulate into major losses.

❌ 1. Unclear Downtimes

Without precise measurement, no one knows exactly when and why machines stop, how long downtimes last, or what their real impact is. Planned, unplanned, and short downtimes are accepted as “just part of the job” instead of being systematically reduced or eliminated.

❌ 2. Rapidly Rising Costs Without Clear Cause

Unnecessary waiting, material waste, overproduction, inefficient production cycles, and reduced machine speeds all increase costs, even when no one seems to be doing anything wrong. If these losses aren’t tracked and analyzed, they can’t be identified, quantified, or strategically reduced.

❌ 3. Invisible Quality Losses

Without consistent measurement, only the biggest failures are reported, while smaller but frequent errors during startup or in-process often go unnoticed. These can add up to significant losses. If they aren’t tracked, they won’t be addressed—and remain hidden costs.

❌ 4. Lack of Transparency in Production Processes

If performance, downtimes, and other key data are recorded manually (on paper or in spreadsheets), the outputs are often inaccurate, delayed, and don’t reflect real-time conditions. There’s no clear view of what’s happening on the floor, making it hard to respond quickly. This lack of agility is a serious disadvantage today.

❌ 5. Ineffecient Reporting and Intuition-Based Decisions

Without reliable performance data, decisions are made based on estimates, experience, or gut feeling. The result is often poor planning, unbalanced workloads, unnecessary stress, and ultimately, increased losses.

These problems result in tangible long-term consequences:

  • Lower efficiency
  • Higher operating costs
  • Reduced competitiveness at home and abroad

How to increase productivity without unnecessary investments

The good news is that higher productivity doesn’t necessarily mean buying new machines, hiring more staff, or pushing people to work faster at the cost of quality. In many cases, it’s the opposite. The greatest impact often comes from better use of what you already have. The key is to know where losses arise, why they happen, and how to reduce or eliminate them.

✅ 1. Start by measuring productivity precisely

The foundation of improvement is accurate data. Without measurement, you can’t know where losses occur or how much they impact your performance. In many cases, productivity increases by 10 to 15% immediately after measurement begins—a phenomenon known as the “halo effect,” where people naturally perform better because they know their output is being tracked.

✅ 2. Automate data collection and eliminate manual errors

If you’re still recording downtimes, breakdowns, and other data manually, you’re leaving room for errors and delays. The solution is automated data collection from machines, production lines, and sensors, using IIoT systems or traditional SCADA/MES platforms. These provide real-time, accurate insights into what’s happening in production.

✅ 3. Focus on uncovering hidden losses

Wasted time, frequent interruptions, poor planning—these are common but often overlooked productivity killers. The “Six Big Losses” model helps categorize these losses into availability, performance, and quality. What makes this model powerful isn’t just naming the six main losses, but assigning clear reduction goals to each. Some can be eliminated completely, while others should be minimized.

✅ 4. Optimize production planning

When you have real-time visibility into machine capacities, line status, and resource availability, you can align production with actual demand—avoiding overloads and downtimes. Integrating MES with ERP or BI systems lets you manage production, maintenance, logistics, and inventory as a unified, data-driven process.

✅ 5. Use visualization and clear reporting

Data is only useful when it’s accessible and understandable. Interactive dashboards in tools like Ignition or Power BI give managers and line operators instant insights into production status, performance, and the root causes of downtime. These insights must be available not just at weekly meetings, but in real time and to everyone who needs them.

✅ 6. Make productivity improvement an ongoing effort

A common mistake is to treat productivity improvements as one-time projects. Successful companies know it’s a continuous process. Regular performance reviews, KPI tracking, and strategic adjustments help maintain improvements and adapt quickly to new challenges.

Labor productivity isn’t about making people work more, but about empowering them to work smarter. To reduce downtime, prevent overloads, and make decisions based on real data—not guesses. That’s why measuring productivity isn’t just another metric. It’s a tool for better decisions, sustainable growth, and a stronger operation.

A Custom Solution from IoT Industries

At IoT Industries, we help you gain precise insights into the performance of your machines and processes, uncover hidden losses, and set measurable goals for boosting productivity. We bring experience with automated data collection, SCADA, MES, OEE implementation, and more—so you can make decisions based on facts, not assumptions. Contact us to find out where your biggest improvement opportunities lie—and how to unlock them. Let’s take your production to the next level.

Why Choose IoT/IIoT Implementation with IoT Industries?

Traditional companies typically specialize in OT (operational technologies, such as production lines and devices) or classic enterprise IT systems. However, we are able to connect both of these worlds. Our unique expertise in integrating OT and IT allows us to deliver innovative solutions in digital transformation, enhancing efficiency, reliability, and competitiveness for manufacturing companies.

OEE – Myslíte si, že vaša výroba funguje na 100 %? Možno prichádzate až o 50 % potenciálu! | OEE – Do You Think Your Production Is Running at 100%? You Might Be Losing Up to 50% of Its Potential!

OEE – Do You Think Your Production Is Running at 100%? You Might Be Losing Up to 50% of Its Potential!

In many manufacturing companies, everything seems to be running smoothly at first glance. Machines are running, workers are working, and the production plan appears to be on track. Management believes that the business is operating at 100% simply because they’ve gotten used to calling this their maximum. But the reality can be quite different. Not because something visibly isn’t working, but because no one realizes that it could work much better. The company may have a hidden potential that remains untapped.

OEE – Myslíte si, že vaša výroba funguje na 100 %? Možno prichádzate až o 50 % potenciálu! | OEE – Do You Think Your Production Is Running at 100%? You Might Be Losing Up to 50% of Its Potential!

Today, the winner in manufacturing is not the one with more machines or a larger workforce. The winner is the one who can maximize the use of the resources already available. And that’s exactly the essence of the OEE – Overall Equipment Effectiveness indicator. It’s one of the most important tools for managing production performance, capable of uncovering where a company’s hidden potential lies. More importantly, it enables this potential to be converted into tangible results.

What Is OEE and What Does It Measure?

OEE is a quantitative indicator of a machine’s overall effectiveness. It measures how efficiently a machine actually operates compared to its full potential, by considering three critically important components: availability, performance, and quality.

  • Availability shows how much time the machine was actually producing compared to how much time it was scheduled to produce.
  • Performance indicates whether the machine produced the expected number of units in the actual production time, based on the ideal cycle time.
  • Quality measures the ratio of defect-free products to total output.

Each of these dimensions is expressed as a percentage, and the final OEE value is the product of these three percentages. In practice, this means that even if each individual component is relatively high, the combined effect may still reveal significant losses.

Example:
If a machine had 100% availability (ran for the full 8 hours) and 100% performance (produced the expected number of pieces), but only 50% of the products met quality standards, the resulting OEE would be just 50%.
Because 100% x 100% x 50% = 50%

OEE is also commonly used as a core metric in methodologies such as Downtime Management, Lean Manufacturing, Six Sigma, or Kaizen.

What Does the Final OEE Value Really Tell Us?

OEE acts like a diagnostic tool, similar to a thermometer. It won’t fix the problem by itself but helps identify it. The final OEE value is above all an indicator of where the company has room for improvement.

  • If availability is low, it’s time to analyze downtime.
  • If performance is poor, focus on optimizing production cycles.
  • If quality is lacking, investigate causes of defects.

Many companies assume they’re running at 90–100%, simply because production appears to be moving. But this subjective perception often hides a harsher reality. Real-world data often reveals that OEE is around 50–60%. In some cases, it’s as low as 45%, meaning more than half of the machine’s potential goes unused.
On the other hand, the “World Class” level of OEE is around 85%, which is already exceptional in many sectors. And the gap between these two levels represents a huge improvement opportunity.

It’s easy to “create” perfect numbers – by setting low production targets or ignoring true cycle times. When data is collected manually, it’s not unusual to see inflated values like 97–98%, which reflect a convenient plan, not actual performance.

Sometimes, with a poorly defined goal and only 50% availability, a company can “achieve” an OEE of over 130%. This is obviously methodologically incorrect.
Only if the cycle times reflect the real mechanical capabilities of the equipment and data collection is accurate, can OEE be a reliable indicator.

What Comes After Measuring OEE?

With a well-configured data collection system, the application itself can identify most of the specific reasons for reduced efficiency:

  • Why is the machine not running?
  • How many minutes per day are lost to short stoppages?
  • How often does material run out?
  • Which breakdowns occur most frequently?

All of this can be monitored in real-time and easily evaluated using clear reports. These reports reveal where the biggest losses occur – whether in terms of time or costs – and give management a solid basis for corrective actions.

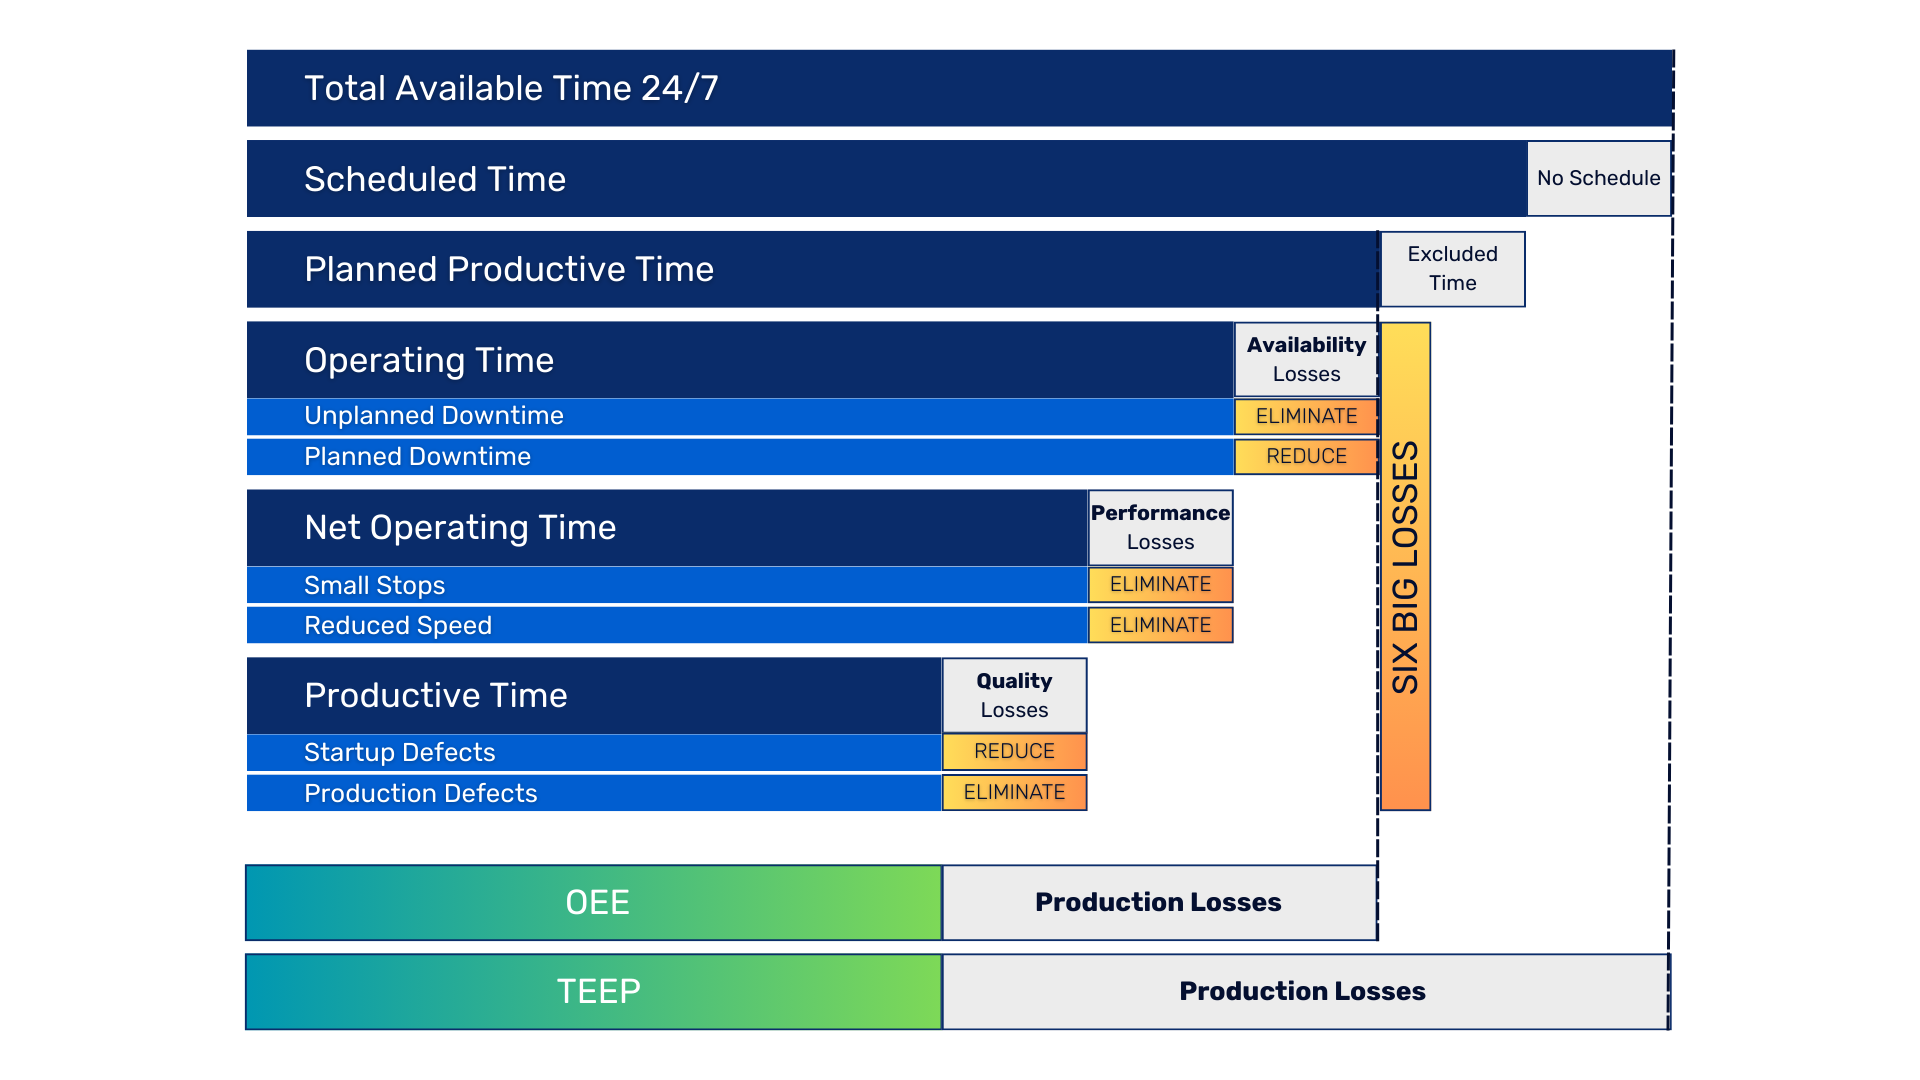
Just like with IoT solutions, the goal isn’t to collect data. The goal is to act on it. That’s why we use the Six Big Losses model.

The Six Big Losses Model

This model categorizes losses into three groups, each linked to one of the three OEE components:

  1. Availability Losses
    • Unplanned Downtime: machine failures, missing materials, unexpected maintenance
    • Planned Downtime: changeovers, scheduled maintenance, cleaning
  2. Performance Losses
    • Short Stops: brief downtimes typically under one minute
    • Reduced Speed: when a machine runs slower than its optimal rate
  3. Quality Losses
    • Startup Defects: errors during machine warm-up
    • Production Defects: non-conforming products during normal operation

What makes this model powerful is not just naming the six major loss types, but also assigning a specific goal for their elimination.

  • Some losses (e.g., unplanned downtime, short stops, speed losses, process defects) can and should be eliminated entirely.
  • Others (like changeovers or startup errors) can at least be minimized.

This structure helps businesses not only define problems but also set realistic and measurable goals – resulting in a much more systematic improvement process.

six big losses

OEE as a Practical Tool, Not Just a Metric

One of the biggest strengths of OEE is its ability to challenge gut feelings with facts. It replaces assumptions with data, emotions with numbers, and “we think we’re efficient” with measurable reality. It exposes hidden machine capacity, which often remains unused simply because no one is tracking it.

With OEE, performance becomes something that can be measured, managed, and improved. It’s not just a metric – it’s a transformational tool.

✅ OEE Increases by 10–15% Right After Implementation

Simply starting to measure – without any other changes – often leads to a dramatic shift in behavior. It boosts discipline, reduces unnecessary downtime, and makes time usage more efficient. This “halo effect” typically results in an immediate OEE boost of 10 to 15%.
Not because the technology changed – but because awareness did.

✅ A Key Milestone on the Road to Digital Transformation

OEE is also an essential step toward digitalizing production.
It replaces paper forms, messy spreadsheets, and imprecise guesses with automated data collection, instantly available real-time reports, and a whole new level of management insight.

Companies that adopt OEE gain continuous visibility into performance – at the level of specific machines, lines, and operations.

✅ Immediate Response to Any Issue

With OEE, data is no longer a historical snapshot – it becomes a daily decision-making tool.
If management sees that a machine loses an hour each shift due to lack of materials, they can act. Maybe the issue is delayed warehouse communication. By adding a simple feature – such as an automatic alert when material drops below 10% – the downtime can be reduced from 60 minutes to just 5.

Not next week. Not after a meeting. But the next day. That’s the power of real-time data.

✅ A Continuous Optimization Process

OEE isn’t just analysis – it’s action.
Everyone from operators to managers has live access to what’s really happening. They know what changed, what worked, and what needs further adjustment. This transforms improvement from a one-off project to a continuous optimization process, built not on guesses, but on data.

✅ Savings of Tens or Hundreds of Thousands of Euros, ROI Within Months

Perhaps most importantly, OEE increases output without needing new machines.
A 25% OEE improvement across 20 machines can achieve the same output gain as buying five new machines, saving tens to hundreds of thousands of euros.

Thanks to the flexible licensing of Ignition software, the return on investment in OEE is often just a few months to a year. And from that point on, the system pays for itself.

Tailor-made end-to-end solution by IoT Industries

OEE is not just a number. It’s a tool for smarter production management – one that connects data, people, and decisions into a single, efficient system. And that’s exactly what modern manufacturing is about – not just producing, but producing effectively.

At IoT Industries, we’re ready to help you with a complete OEE implementation – from data collection to visualization.
Get in touch with us today.

Why Choose IoT/IIoT Implementation with IoT Industries?

Traditional companies typically specialize in OT (operational technologies, such as production lines and devices) or classic enterprise IT systems. However, we are able to connect both of these worlds. Our unique expertise in integrating OT and IT allows us to deliver innovative solutions in digital transformation, enhancing efficiency, reliability, and competitiveness for manufacturing companies.