HMI v priemysle | Ako má vyzerať moderný Human-Machine Interface? | HMI in Industry | What Should a Modern Human-Machine Interface Look Like?

HMI in Industry | What Should a Modern Human-Machine Interface Look Like?

If you manage production, you probably have access to more data today than ever before. Even so, a simple problem can arise at a critical moment. An operator, technician, or shift supervisor may not be able to understand quickly enough what is happening, where the problem occurred, and what the next step should be. If a screen displays dozens of colors, values, and icons without a clear priority, people cannot quickly distinguish between a normal state, a warning, and a truly critical condition. And if the interface does not help them do so, the HMI becomes another source of cognitive load.

That is precisely why HMI (Human-Machine Interface) is one of the most important layers of modern industrial automation. Modern HMI design should not primarily be visually appealing. It should be clear, safe, consistent, and designed around how people work in real-world operations. A well-designed HMI helps operators respond more quickly, maintenance personnel identify the causes of problems more efficiently, management better understand production, and the company reduce the risk of errors, downtime, and inefficient interventions.
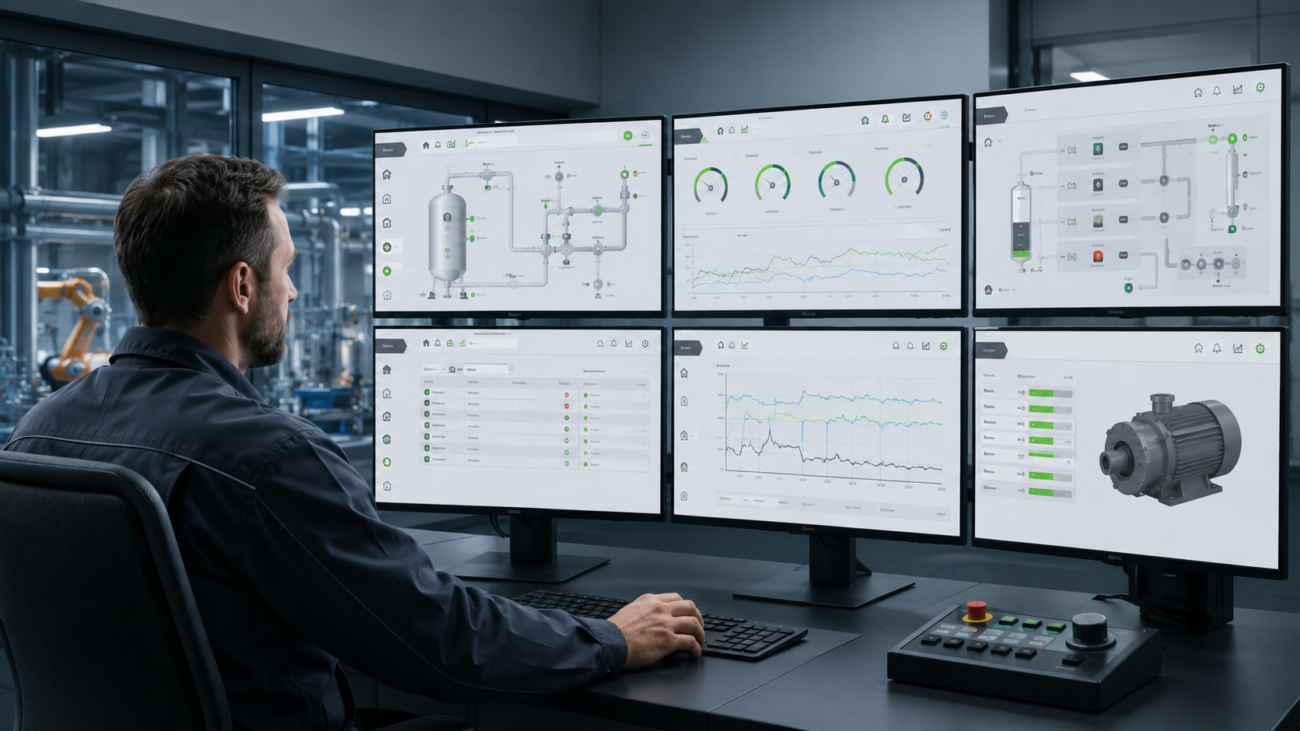
HMI v priemysle | Ako má vyzerať moderný Human-Machine Interface? | HMI in Industry | What Should a Modern Human-Machine Interface Look Like?

Human-Machine Interface – DEFINITION

What does HMI (Human-Machine Interface) mean?

The definition of 💡 Human-Machine Interface is essentially simple. HMI is a user interface through which a person communicates with a machine, production line or the entire process. The main significance of HMI lies in the fact that it turns raw data into usable information. In practice, HMI enables users to monitor operating values, control equipment, change permitted parameters, acknowledge alarms or analyze trends. A good HMI is therefore a critical point of interaction between a person and the system.

Why does HMI fail even when the technology works correctly?

❌ In many companies, digital transformation places the greatest emphasis on hardware, data collection, and architecture, as well as various integrations. This is understandable because without a reliable technical layer, the system cannot function. The problem arises when the user interface is addressed only at the end of the project as a visual output that is supposed to “somehow display the data.” The result is then an HMI that is technically correct but operationally weak.

Screens often copy process schematics, contain too many details, and use many colors, animations, and icons, while all elements have similar visual importance. The operator then cannot clearly see what is merely a normal part of the process and what genuinely requires attention. During a fault, they even have to switch between multiple views to piece together a picture of the situation. Inconsistency is also a common problem. One screen uses red for an alarm, while another uses it for an important parameter.

❌ This situation arises mainly because HMI is designed from the technology’s perspective, not the user’s perspective. The designer knows how the line works, where the equipment is located, and what the individual values mean. However, at a particular moment, the operator needs answers to more practical questions: Is the process within normal limits? Where did the deviation occur? What is causing it? What action is required? And what will happen if I do nothing? If HMI does not answer these questions quickly and clearly, it fails to fulfill its main role.

Most common risks of poor HMI

⚠️ The first risk is a slower response to faults and deviations. If the operator cannot see which parameter has moved outside the normal range, how long the problem has lasted, and which part of the production system is causing it, they lose time looking for connections. Instead of taking immediate action, they analyze the screen, switch between views and verify information with colleagues. In practice, even a short delay can mean longer downtime, higher costs and a greater risk that a minor deviation will become a more serious operational problem.

⚠️ The second risk is incorrect interventions. If the system does not display clear alarm priorities, the user may respond to a less important problem and overlook a critical condition. The problem is even greater when the HMI generates too many alarms. Operators get used to them, start acknowledging them automatically and the alarm stops being a signal that requires attention. This phenomenon is so common that it is known as alarm fatigue, or fatigue caused by alarms.

⚠️ The third risk is lower work efficiency. If a simple operation requires an unnecessarily high number of clicks, if data has to be transcribed manually or if the user cannot quickly find the information they need, the system slows down work instead of speeding it up. In practice, this may mean, for example, that the operator spends more time operating the system than actually resolving the situation in production. With repetitive tasks, these small time losses gradually add up and can represent significant inefficiency.

⚠️ The fourth risk is dependence on experienced individuals. In companies with weak HMI, it is often the case that an experienced operator “knows where to look for things”, but a new employee gets lost in the system. This extends training, increases the risk of errors and makes work standardization more difficult. The problem becomes most apparent during staff changes or holidays or in crisis situations, when an experienced employee is not currently available. A quality HMI should ensure that the correct procedure does not depend solely on a specific operator.

⚠️ The fifth risk is poorer scalability of the entire system. If each screen is created without uniform rules, each new technology introduces its own control logic, different colors, different navigation and a different way of displaying information. This complicates system expansion, increases maintenance costs and means that instead of a unified digital environment, a collection of inconsistent screens emerges. At a larger scale, every modification or extension becomes unnecessarily more difficult than it would be with a unified HMI standard.

HMI Design Standards

HMI design standards have a highly practical significance in industry. They ensure that the interface does not depend on personal taste of a particular designer, but on uniform rules that can be used throughout the entire plant. HMI guidelines should therefore define how colors, typography, symbols, and navigation are used… If a company has multiple lines, production halls, or facilities, a unified HMI standard significantly simplifies the work of operators, maintenance teams, and internal technical teams.

When designing a modern HMI, the ISA-101 standard is often used as a basis. It helps establish rules for how HMI screens should be designed, used, and maintained over the long term. The aim is for the user to quickly understand what is happening and respond to abnormalities in time and for all screens to operate according to the same logic. The ISA-101 standard was even recently adopted as the international standard IEC 63303. This officially placed its principles among recognized standards used throughout industry worldwide.

Modern Human-Machine Interface Design

➡️ Modern Human-Machine Interface design no longer “displays everything”. It should display only essential information, and do so in a way that allows people to understand it quickly and correctly respond to it. In practice, this means that if everything is running correctly, temperatures are within normal limits, pressure is stable, and equipment is operating as expected, the screen does not need to be filled with bright colors, flashing elements, and animations. Quite the contrary. Normal operation should be displayed neutrally, so operators do not have to constantly evaluate every detail.

➡️ Visual emphasis should be reserved for deviations. This is where the use of colors plays an important role. Gray and neutral shades represent normal conditions. Yellow or orange indicates a warning, a deviation or a condition that requires attention. Red is reserved for critical situations in which an immediate response is required. As a result, every color has a clear meaning and the operator does not have to think about what a given visual element means.

➡️ Good HMI design, however, does not base the meaning of information solely on color. In practice, it is also necessary to consider that some users may have color vision deficiency. Therefore, critical states, alarms, and important warnings should be supplemented with unambiguous shapes, symbols or text labels. This allows the operator to distinguish important information even when they do not perceive colors in the same way as others. The result is an interface understandable to a wider range of users.

➡️ Also very important is the hierarchy of screens. High Performance HMI does not overwhelm the user with details on the home screen right away. First, it shows the overall state of the process. Next, it directs the user to the part where the problem occurred. Only then does it offer details of the specific device, a trend, diagnostics or service information. The user therefore does not have to search the entire system during a fault, but proceeds naturally from the general overview to the specific cause and solution.

➡️ No less important is displaying values in context. A number on its own often is not enough for the user, because it does not show whether the condition is still safe, approaching a limit or gradually deteriorating. A modern HMI should therefore also work with normal ranges, trends, and limits, so that the operator sees not only the current state, but also its progression. This enables the operator to better distinguish a short-term fluctuation from a problem that is gradually worsening. The operator can thus respond proactively, rather than only when a fault occurs.

Human-Machine Interface – EXAMPLE

What is the difference between a poor and a modern HMI?

Let us imagine, for example, a production line that has stopped. In a poor HMI, the operator sees a large process schematic, numerous icons, and several alarms at once. They have to manually determine whether the problem was caused by a safety stop, missing material, or a motor fault. A modern HMI design would handle the same situation differently. In a High Performance HMI, they first see that the line is stopped. The system then clearly indicates that the problem is in a specific part of the line. After opening the details, they discover that material is missing from the hopper and the equipment is therefore waiting.

This approach significantly reduces the operator’s cognitive load. The operator does not have to monitor everything continuously. The system alerts them to what is deviating from normal and at the same time logically guides them from the overall overview all the way to the specific cause of the problem. This is the main value of modern HMI design. It does not appear as an overcrowded screen full of data, but as a work tool that helps people act quickly and safely. The result is an interface that does not demand attention constantly, but only when it is genuinely needed.

Human-Machine Interface – SIGNIFICANCE

How does HMI affect costs, safety, and decision-making in manufacturing?

Human-Machine Interface has fundamental importance in industrial automation. The system itself may collect accurate data, machines may be reliably connected, and processes may be automated, but if the user does not understand what they see on the screen, the value of the entire solution is significantly reduced. A well-designed HMI interface is therefore not merely a matter of operator convenience. It has a direct impact on operational costs, production efficiency, safety, and data quality, as well as the company’s ability to make better decisions.

One of the greatest benefits of a high-quality HMI is faster response to faults, deviations, and abnormal conditions. The operator can more quickly understand whether the process is within normal limits, where the problem occurred, and what action is required. For the company, this means a shorter response time, less unnecessary downtime and lower costs caused by delayed intervention. HMI also helps maintenance personnel identify the cause of a problem more quickly and plan service interventions more efficiently.

A quality HMI also reduces the risk of incorrect interventions. If alarms are clearly prioritized, critical conditions are clearly differentiated and control elements are designed unambiguously, the user can make the right decision even under pressure. This is important especially during faults, operating mode changes or when working with critical equipment. The result is greater operational safety, a lower risk of equipment damage and more stable production quality.

A properly designed HMI also helps train new employees. If screens have a consistent logic, the same color coding and consistent navigation, a new operator can find their way around the system more quickly. Work can be standardized more easily across shifts, lines, or facilities. This reduces the risk of errors, shortens training time and helps maintain a more stable operating approach even when personnel changes.

From the perspective of supervisors and management, Human-Machine Interface is also significant because it improves the quality of operational information. If HMI clearly displays line performance, reasons for downtime, recurring alarms, trends or deviations from the plan, it becomes an important source of data for process improvement. Management can therefore make decisions based on actual production conditions, not merely according to delayed reports, subjective estimates or incomplete records.

Ultimately, a quality HMI delivers concrete results to the company:

✅ Faster responses and less downtime
✅ Lower risk of errors and greater safety
✅ Easier employee training
✅ Reduced operating costs
✅ More efficient production management

Human-Machine Interface – APPLICATIONS

Where does HMI connect with SCADA, MES, OEE, CMMS, EMS, BMS, and BI?

Human-Machine Interface applications today are not used only to control a single machine. In modern facilities, they are often part of a broader digital ecosystem that connects production, maintenance, energy management, and building management as well as management decision-making. An example of a platform in which such HMI applications can be created is Ignition. The advantage of this approach is that HMI can grow with the facility and gradually expand to include additional functions.

When connected to a SCADA system, Ignition can display the state of the process, real-time operating values, and alarms or trends. In combination with an MES system, it can add production context, such as the plan, the number of units produced or the reasons for downtime. A separate area is OEE, where HMI helps monitor equipment availability, performance, and quality so that the company can see where the greatest production losses occur and subsequently eliminate them.

When connected to a CMMS system, it can help maintenance handle faults and service interventions as well as planned maintenance. HMI applications are also relevant to EMS and BMS systems, where they help monitor energy consumption and control heating, cooling, lighting, ventilation systems and other technologies. Data from these areas can subsequently be further analyzed in BI tools, such as Power BI. The company thus gains not only an up-to-date overview of operations, but also a basis for long-term optimization.

How to Begin Modernization?

HMI modernization should not begin with selecting colors or redrawing icons. It should begin with an audit of the current state. Look at the screens that are used most frequently. Find out where operators lose time, which alarms recur, which values they have to look up manually, and where errors occur and which tasks are unnecessarily complicated. A Human-Machine Interface diagram is also helpful when designing a solution, as it shows how HMI fits into the overall technological and data environment.

Next, it makes sense to create or update an HMI standard. It should define rules for screen layout, colors, typography, and symbols as well as navigation. If this step is skipped, every new screen may look different and the company will simply create a more modern version of the original chaos. A good HMI standard also simplifies work when expanding the system further, because new screens are not created from scratch, but according to a clearly defined logic.

For larger facilities, it is advisable to start with a pilot project. Select one technology, process or production line where improving the HMI offers a clear benefit. Design a new concept, test it with users, adjust it based on feedback and only then extend it to other parts of the facility. It is also important to think about training. Operators need to know why the screen looks different, what the new rules mean and how the new system will help them in their work.

How Do We Help with HMI at IoT Industries?

At IoT Industries, we view HMI as part of the entire digital ecosystem, not as a standalone graphic screen. When designing a solution, we therefore also address data sources, architecture, integration with other systems and practical usability in operations. We help companies analyze existing screens, identify weak points, design an HMI standard, prepare prototypes of new screens, and implement the solution so that it makes sense to operators, maintenance teams, and management.

Thanks to our many years of experience, we can connect the world of operational technology with IT systems and create interfaces that not only display data, but help people use it in practice. If you want to find out whether your current HMI truly helps people in your operations, schedule a consultation with us. We will review your existing interfaces and identify opportunities for improvement and propose practical steps for turning HMI into a tool that delivers real value for your production.

Why Choose IoT/IIoT Implementation with IoT Industries?

Traditional companies typically specialize in OT (operational technologies, such as production lines and devices) or classic enterprise IT systems. However, we are able to connect both of these worlds. Our unique expertise in integrating OT and IT allows us to deliver innovative solutions in digital transformation, enhancing efficiency, reliability, and competitiveness for manufacturing companies.
Prečo sú dnes elektronický zber údajov a analýza údajov kľúčom k udržaniu konkurencieschopnosti? | Why Are Electronic Data Collection and Data Analysis Essential for Maintaining Competitiveness Today?

Why Are Electronic Data Collection and Data Analysis Essential for Maintaining Competitiveness Today?

If you manage a manufacturing company, you likely make dozens of decisions every day. About orders. About capacities. About failures. But do you base these decisions on accurate and up-to-date data? Or do you make decisions based on estimates and delayed reports? If you lean more toward the latter option, you are not alone, however this approach is no longer sufficient today. For modern manufacturing, electronic data collection and real-time data analysis are a key condition for maintaining competitiveness. Because without them it is not possible to effectively manage performance, costs, or quality.
Prečo sú dnes elektronický zber údajov a analýza údajov kľúčom k udržaniu konkurencieschopnosti? | Why Are Electronic Data Collection and Data Analysis Essential for Maintaining Competitiveness Today?

What exactly happens in a company where electronic data collection and data analysis are missing?

Even a company where electronic data collection and systematic data analysis are missing may at first glance appear stable and under control. The problem is not that production does not work. The problem is that no one knows exactly how well, or how poorly, it actually works.

You may find this situation familiar:

  • The operator records downtime manually.
  • Reasons for failures are entered generically, such as “repair” or “cleaning”.
  • Performance is evaluated only after the shift ends.
  • Energy consumption is known only from the monthly invoice.
  • There is no single source of truth, so each department works with different numbers.

And the result?

  • ❌ Outdated, inaccurate and incomplete data
  • ❌ Unclear causes of problems with no ability to correct them
  • ❌ Hidden unused production potential
  • ❌ Increasing costs without a clear explanation
  • ❌ Decisions based on assumptions instead of facts

Production may be running, but significantly below its real potential. Problems are solved retrospectively and corrective measures arrive only after the costs have already been incurred. The enterprise operates in an environment of uncertainty where there is no clear picture of what is actually happening in production.

What is electronic data collection?

Electronic data collection means that production data is not collected through manual recording on paper or in Excel, but automatically, directly from machines, sensors, production lines and enterprise systems. Without manual transcription, without delays and without the risk of errors.

Electronically collected data can be divided into several groups:

1️⃣ Production process data, which shows what and how much was actually produced, for example production counts, cycle times and real operation times, and information about which order or reference the machine is currently processing.

2️⃣ Availability and downtime data, meaning when a machine is producing, when it is stopped and why. This includes downtime data (both planned and unplanned), specific reasons for downtime (missing material, failure, tool change, waiting for operator) and various fault and alarm states.

3️⃣ Quality data, which shows how much of the produced output is actually compliant. Typically this includes the number of good and defective pieces, types and categories of defects or information about batches in which deviations repeat.

4️⃣ Consumption and cost data, which connects production with the economic reality of the enterprise. This mainly includes energy consumption (electricity, gas, water…), consumption of materials and semi-finished products, or data from EMS and BMS systems.

5️⃣ Order and production flow data, which connects production with planning and sales, for example order status (what is running, what is finished, what is delayed), the progress of individual operations over time or comparison of plan versus reality.

Such an automated data collection setup creates a consistent data foundation, the Single Source of Truth (SSOT), meaning a single source of truth for the entire enterprise. Only on this basis does data analysis make real sense, because it works with accurate, complete and up-to-date information.

Data collection alone is not enough. Data analysis is the key.

Electronic data collection is the foundation, not the final solution. Many enterprises today already collect data, but despite that they are unable to extract real value from it. The reason is simple. Real impact comes only through systematic data analysis.

Properly configured data analysis makes it possible to answer questions such as:

  • Which shift achieves the lowest efficiency and why?
  • Which machine generates the most unplanned downtime? And what are the main causes?
  • Why does quality fluctuate at certain times or with specific products?
  • Where do hidden costs arise that are not visible in standard reports?
  • How does the planned production flow differ from the real one?

And the answers to these questions immediately translate into enterprise management:

  • ✔ Increase productivity without the need to invest in new machines
  • ✔ Reveal hidden reserves and sources of savings
  • ✔ Enable informed decision-making
  • ✔ Reduce uncertainty in planning
  • ✔ Strengthen the competitiveness of the enterprise

The difference between a company that only collects data and a company that actively analyzes it is fundamental. The first reacts only after a problem occurs. The second can identify the problem at its earliest stage and gradually prevent it.

And this is exactly where automated data collection and data analysis merge into a single functional system. While data collection creates an accurate picture of reality, analysis turns that picture into a management tool.

How to start with electronic data collection and analysis?

The implementation of electronic data collection and subsequent data analysis should not be a technological experiment. It should be a managed project with a clear objective, measurable benefits and gradual expansion.

If you do not know where to start, we recommend a systematic approach:

1️⃣ Define a clear objective

The most common mistake manufacturing companies make during implementation is starting with technology instead of the objective. First answer the question what exactly you want to improve. Do you want to reduce downtime? Do you want to optimize energy consumption? Do you want to increase OEE by 10%?

Without a clear objective, electronic data collection can become uncontrolled accumulation of data without a concrete impact. The objective, on the other hand, determines which data you will collect, which KPIs you will track and which reports will actually make sense.

2️⃣ Perform an audit of existing systems

Many enterprises already possess a large amount of data today, they just often do not realize it. Therefore it is important to map what data you already collect, where this data is located, whether it is interconnected and most importantly whether it is accurate and consistent.

Such an audit often reveals duplicate records, different versions of the same numbers, missing timestamps or insufficient categorization. Only on the basis of this overview does it make sense to design a new system or expand an existing one.

3️⃣ Start with a pilot project (PoC)

There is no need to digitalize the entire enterprise at once. A more effective approach is a pilot project on a single production line or within one department. A pilot project brings several advantages, such as lower risk, faster return on investment and easier internal communication of results.

The goal of the pilot is to set up data collection and data analysis correctly from the beginning, verify the functionality of the solution in practice and quantify the first measurable benefits. If the pilot demonstrates real value (for example an 8% reduction in downtime), it then becomes much easier to expand the project across the entire plant.

4️⃣ Connect electronic data collection with data analysis

As mentioned earlier, electronic data collection without subsequent analysis does not bring value. It is therefore important to define which KPIs will be monitored, how data will be visualized, who will be responsible for evaluating it and above all how the insights will translate into decision-making.

High-quality data analysis should clearly answer management questions: Why did efficiency drop today? Which line is currently the most loaded? Where does the deviation from plan occur? If a manager opens the dashboard and immediately sees the answer, the system is functioning correctly.

5️⃣ Scale the solution and create a continuous improvement process

If the pilot demonstrates measurable results, the next step is gradual expansion of the solution to other production lines, departments or areas of the enterprise. Such gradual scaling also allows risk to be minimized, investments to be spread over time and return on investment to be continuously evaluated.

However, automated data collection and data analysis should not be a one-time project. Their real value lies in creating a continuous improvement cycle:

  1. You collect data in real time.
  2. You analyze it and identify the causes of deviations.
  3. You implement specific corrective measures.
  4. You evaluate the impact of those measures.
  5. You optimize processes and the cycle repeats.

Electronic data collection and analysis are not the objective. They are a tool for systematically increasing enterprise performance year after year. In this way electronic data collection becomes a permanent part of enterprise management. Production is not optimized once, but systematically and continuously.

Electronic data collection as the foundation of digital transformation

Electronic data collection and data analysis are no longer a technological luxury. They are a fundamental prerequisite for a manufacturing enterprise to gain control over performance, costs and quality, the ability to respond faster than competitors, and a stable competitive advantage.

At IoT Industries we help manufacturing companies design and implement tailor-made solutions. From the initial audit of data readiness, through a pilot project, to gradual scaling across the entire plant. Not as a one-time IT project, but as a systematic tool for improving performance.

If you want to find out where unused potential is hidden in your production, contact us and we will be happy to take a look together with you.

Why Choose IoT/IIoT Implementation with IoT Industries?

Traditional companies typically specialize in OT (operational technologies, such as production lines and devices) or classic enterprise IT systems. However, we are able to connect both of these worlds. Our unique expertise in integrating OT and IT allows us to deliver innovative solutions in digital transformation, enhancing efficiency, reliability, and competitiveness for manufacturing companies.

Data mining – Ako z výrobných dát vyťažiť skutočnú hodnotu | Data mining – How to extract real value from manufacturing data

Data Mining – How to Extract Real Value from Manufacturing Data

In today’s manufacturing companies, enormous amounts of data are generated every day. Yet despite this, many organizations feel that they are “getting nothing” out of their data. Data is collected, numbers are tracked, reports exist—but the real relationships, trends, and root causes of problems remain hidden. This is where data mining comes into play—a systematic way to uncover insights in data that are not visible at first glance. In modern industry, data mining becomes a practical tool that helps reduce costs, increase efficiency, and support better decision-making based on facts rather than intuition.

Data mining – Ako z výrobných dát vyťažiť skutočnú hodnotu | Data mining – How to extract real value from manufacturing data

Definition of Data Mining

Data mining is the process of discovering patterns, relationships, trends, and anomalies in large volumes of data. Its goal is not merely to collect and display data, but to uncover hidden connections that are not visible in standard tables, charts, or reports. Simply put, while reporting answers the question “what happened?” and analysis answers “why did it happen?”, data mining goes even further and answers questions such as “what will happen if…?” or “where does the same problem keep recurring?”.

The Importance of Data Mining in Practice

The importance of data mining lies in its ability to transform large volumes of fragmented data into concrete insights that have a real impact on business operations. Without data mining, companies often react only after a problem occurs. With data mining, however, organizations move into a position where they can anticipate problems instead of merely firefighting their consequences. This predictive capability is where its true strategic value lies.

Different Data Mining Techniques

Data mining techniques represent specific analytical methods and procedures used to extract meaningful insights from large datasets. Each technique focuses on a different type of problem—some identify patterns, others relationships, trends, or anomalies. Thanks to these techniques, data mining goes beyond traditional reporting and reveals connections that would otherwise remain unnoticed in tables or charts.

The most common data mining techniques include:

  • Classification – assigning data to predefined categories
  • Clustering – identifying natural groupings in data without predefined rules
  • Association rules – discovering relationships such as “if A occurs, B often follows”
  • Regression analysis – identifying relationships between variables
  • Anomaly detection – identifying abnormal behavior or failures

Their value lies in the fact that they enable automated analysis of thousands to millions of records and the discovery of recurring patterns in data. In manufacturing, this means the ability to identify root causes of defects, uncover inefficient process settings, or detect early signals of impending failures. Without these techniques, data may exist, but its potential remains untapped. With them, data is transformed into actionable insights with a direct impact on costs, efficiency, and production reliability.

Why Data Mining Alone Is Not Enough

Data mining is an extremely powerful tool, but its value only emerges when it has access to high-quality, up-to-date data. If data is collected manually or with delays, analytical results will not reflect reality. That is why data mining makes the most sense as part of a broader digital transformation process that ensures automated and reliable data collection directly from production. Only then can analyses deliver real impact.

One of the most important—yet often underestimated—steps in data mining is data preprocessing. If this step is missing, even the best analytical models will produce distorted or unreliable results. The rule is simple: poor-quality data leads to poor-quality decisions. That is why data preprocessing is the foundation of every successful data mining project.

Before analysis, data must be:

  • cleaned of errors and duplicates,
  • aligned in terms of formats and units,
  • completed with missing values,
  • stripped of irrelevant information,
  • connected across multiple data sources.

How Data Mining and Business Intelligence Are Connected

It is important to distinguish between data mining and Business Intelligence. BI tools, such as Power BI, provide clear dashboards, visualizations, and reports. They show what is happening in production—either in real time or retrospectively. Data mining goes deeper. It works directly with raw data and uses statistical and analytical methods to identify patterns, dependencies, and deviations. Data mining generates insights, while BI then makes those insights accessible in an understandable form.

A Comprehensive Data Approach from IoT Industries

At IoT Industries, we do not view data mining as an isolated analytical activity. For us, it is a natural continuation of production data collection and processing. We help companies build the entire data value chain—from automated data collection and preprocessing, through analysis, to clear visualizations. Our goal is to ensure that manufacturing companies transform data into decisions, decisions into actions, and actions into measurable results.

If you want to discover the potential hidden in your data, get in touch with us and we’ll be happy to show you how data mining can work in your manufacturing environment as well.

Why Choose IoT/IIoT Implementation with IoT Industries?

Traditional companies typically specialize in OT (operational technologies, such as production lines and devices) or classic enterprise IT systems. However, we are able to connect both of these worlds. Our unique expertise in integrating OT and IT allows us to deliver innovative solutions in digital transformation, enhancing efficiency, reliability, and competitiveness for manufacturing companies.

Optimalizácia nákladov vo výrobných podnikoch vďaka digitálnej transformácii | Cost optimization in manufacturing companies thanks to digital transformation

Cost Optimization in Manufacturing Through Digital Transformation

With the rising costs of materials, labor, and energy, cost optimization has become a matter of survival for manufacturing companies. It is no longer enough to cut costs by reducing staff, limiting overtime, or postponing investments. The key to sustainable savings lies in digital transformation — enabling companies to make better use of existing resources, uncover hidden inefficiencies, and turn them into measurable savings.

However, success doesn’t come from a single tool. It’s achieved by connecting the entire infrastructure — from data collection (MES), through production monitoring and control (SCADA), performance tracking (OEE), predictive maintenance (PdM), energy and building management (EMS/BMS), all the way to data processing and reporting (BI).

Optimalizácia nákladov vo výrobných podnikoch vďaka digitálnej transformácii | Cost optimization in manufacturing companies thanks to digital transformation

Why Traditional Cost-Saving Methods Are No Longer Enough

Conventional cost-cutting approaches — such as reducing staff, limiting overtime, or postponing investments — deliver only short-term results and often weaken a company’s competitiveness. These methods don’t address the root causes of high costs; they merely mask the problem temporarily.

Digital transformation, on the other hand, enables companies to identify and eliminate hidden inefficiencies directly within their production processes — from inaccurate planning and unnecessary downtime to excessive energy consumption. With modern systems in place, management gains a precise, real-time overview of production and can make informed decisions that lead to sustainable cost reductions and improved competitiveness.

Where Do Hidden Costs Lurk in Manufacturing?

💸 Without digitalized production processes, companies rely on manual data collection and paper-based planning. This leads to inefficient production management, delayed orders, or — on the other hand — excessive inventory levels.

💸 When remote control and real-time monitoring of equipment are missing, downtimes last longer than necessary. Without historical data, it’s also impossible to analyze the causes of failures and prevent them in the future.

💸 Without tracking machine availability, performance, and quality, companies lose the ability to identify bottlenecks and inefficiencies. As a result, machines operate below their potential, overall productivity drops, and costs rise.

💸 Without predictive maintenance, problems are only addressed after a breakdown occurs. Reactive maintenance means longer downtimes, more expensive repairs, and unplanned costs that could have been easily avoided.

💸 Without systematic monitoring of energy consumption and building systems, companies use more resources than necessary. Without optimization, energy bills rise — and the company risks failing to meet legislative or environmental requirements.

💸 Without proper data analysis and reporting, management makes critical decisions based on inaccurate or delayed information. The result: poor cost optimization, lower productivity, and a weakened competitive position.

What Does Cost Optimization Through Digital Transformation Look Like?

💰 MES (Manufacturing Execution System) connects automated production planning with real-time shop floor activity. It reduces costs by eliminating manual data entry, improving resource utilization, and preventing overproduction or delays.

💰 SCADA (Supervisory Control and Data Acquisition) enables real-time monitoring of production equipment and immediate response to deviations or failures. Historical data storage helps uncover root causes of problems and prevent them from recurring.

💰 OEE (Overall Equipment Effectiveness) measures the availability, performance, and quality of machines. It often reveals that equipment operates at only 50–60% of its actual potential. By increasing OEE, companies can achieve savings comparable to investing in new machinery.

💰 Reactive maintenance is costly and causes unnecessary downtime. In contrast, PdM (Predictive Maintenance) uses sensors and analytics to forecast failures before they occur. This lowers maintenance costs, extends equipment lifespan, and increases production reliability.

💰 EMS (Energy Management System) and BMS (Building Management System) monitor and control energy consumption and building operations in real time. They help reduce energy bills and operating costs while supporting compliance with environmental and regulatory standards.

💰 Business Intelligence (BI) acts as the layer that ties all systems together. It collects, analyzes, and visualizes data, giving management clear answers to key questions: Where do the biggest losses occur? Where can costs be optimized? Which measures bring the greatest savings?

Cost optimization doesn’t always mean budget cuts. It often means uncovering and eliminating inefficiencies, waste, and downtime. But this is only possible when a company works with accurate data and reliable tools. If you want to reduce costs, increase productivity, and prepare your business for Industry 4.0, the path forward lies in digital transformation.

Comprehensive Tailor-Made Solution from IoT Industries

At IoT Industries, we’ll help you every step of the way — from designing your data architecture, integrating systems, and connecting technologies to creating custom interactive dashboards tailored to your operations.
Contact us and discover how modern digital solutions can save your company tens of thousands of euros every year.

Why Choose IoT/IIoT Implementation with IoT Industries?

Traditional companies typically specialize in OT (operational technologies, such as production lines and devices) or classic enterprise IT systems. However, we are able to connect both of these worlds. Our unique expertise in integrating OT and IT allows us to deliver innovative solutions in digital transformation, enhancing efficiency, reliability, and competitiveness for manufacturing companies.

Nástroje Business Intelligence, ktoré premenia dáta z vašej výroby na zisk | Business Intelligence tools that turn your production data into profit

Business Intelligence tools that turn your production data into profit

In modern manufacturing companies, it is no longer enough to make decisions based solely on experience or intuition. Competitors are moving ahead thanks to accurate and instantly accessible data. If your company still relies on paper forms, Excel spreadsheets, and delayed reports, you are losing profit, flexibility, and customers. The solution lies in Business Intelligence tools that can transform all your data into clear visualizations and reliable insights for decision-making.

Nástroje Business Intelligence, ktoré premenia dáta z vašej výroby na zisk | Business Intelligence tools that turn your production data into profit

What is Business Intelligence?

BI – Business Intelligence is a set of processes, technologies, and tools that transform large volumes of data into clear, actionable information. It provides a systematic approach to collecting, storing, analyzing, and visualizing data. Instead of raw numbers in spreadsheets, it delivers clear insights and interactive dashboards that reflect the real state of processes within a company.

What challenges do manufacturing companies face without Business Intelligence?

Without modern Business Intelligence solutions, companies encounter a range of recurring issues.

Data is often collected manually — a process that is both time-consuming and prone to errors. Reports are generated with delays and frequently contain inaccurate or distorted information. As a result, management receives unreliable data for decision-making, often too late to respond effectively. Without access to precise and up-to-date information, many business decisions end up being based more on intuition than on facts, significantly reducing the company’s ability to react to market changes and stay competitive.

Another common problem is that each department works with its own set of figures, leading to discrepancies and misunderstandings. There is no unified source of truth (Single Source of Truth – SSOT) to ensure consistent data across the organization. This often results in inaccurate production planning — for example, sales may commit to orders that exceed production capacity, or conversely, excessive inventory builds up and ties up valuable capital. The outcome is lost efficiency, higher operational costs, and a weakened competitive position.

How does Business Intelligence solve these problems?

✅ Automated Data Collection

Unlike manual data entry, BI ensures automatic data collection. This saves employees’ time, minimizes the risk of errors, and makes all information available almost instantly.

✅ Data Analysis and Visualization in Just a Few Clicks

Instead of cluttered spreadsheets, BI instantly analyzes data and transforms it into clear visualizations. Interactive reports and dashboards give managers a real-time view of production status or financial performance, enabling quick reactions to any deviations.

✅ Unification of Data into a Single Source of Truth (SSOT)

Each department no longer needs to rely on its own numbers. BI creates a unified Single Source of Truth, ensuring that everyone in the company works with the same, accurate data. This eliminates conflicts and improves coordination between sales, production, and logistics.

✅ Faster and More Accurate Decision-Making Across the Organization

BI provides management with reliable, up-to-date insights. Decisions are made based on facts rather than estimates or intuition. As a result, the company can respond more flexibly to market changes, improve efficiency, and reduce costs.

Business Intelligence Tools

When implementing Business Intelligence (BI), it is crucial to select the right tools — ones that can not only process data efficiently but also visualize it clearly and make it accessible to all levels of management. Among the most widely used technologies are:

Microsoft Power BI is one of the most powerful Business Intelligence tools on the market. It enables automatic data collection from various systems, performs advanced analyses, and displays the results through interactive dashboards. This provides an instant overview of production performance, orders, and financial indicators — anytime, from any device. Power BI also offers seamless integration with other Microsoft applications, making cross-department collaboration easier and more efficient.

Microsoft Power BI Report Server (PBIRS) is the successor to SQL Server Reporting Services (SSRS). PBIRS bridges the Power BI environment with the robust capabilities of SSRS, particularly the ability to create detailed and precisely structured Paginated Reports — ideal for regular reporting and audit purposes. It ensures that companies have access to consistent, officially approved data that can be easily distributed throughout the organization.

Together, these tools form the ideal Business Intelligence ecosystem: Power BI provides real-time flexibility and visualization, while Power BI Report Server ensures accuracy and compliance through formal reports.

Why Business Intelligence tools alone are not enough?

Even the best BI tools rely on high-quality input data. If the data is incomplete or delayed, the reports will never be accurate. That’s why integration with modern systems that collect data directly from production lines — such as SCADA or MES — is essential. Only then can Business Intelligence reflect the true reality of operations and provide real value for everyday decision-making.

Why should your company use Business Intelligence (BI)?

Today, BI – Business Intelligence is no longer reserved for large corporations. It has become a necessity for every modern manufacturing company. By implementing BI, you gain a complete and accurate picture of what is happening within your organization. This allows you to react faster to changes, plan more effectively, and maintain your competitive edge.

Instead of making decisions based on assumptions, you’ll rely on facts and real data. This enables you to optimize production, increase productivity, and eliminate unnecessary costs. BI is not just a technological solution — it’s a strategic tool that helps you transform data into profit and take your business to the next level.

Comprehensive Tailor-Made Solution from IoT Industries

At IoT Industries, we don’t see BI as a standalone tool — we view it as part of a comprehensive, interconnected solution. That’s why we help you design and optimize data flows across your entire production environment, integrate BI tools with SCADA, MES, ERP, and other systems, and create clear, interactive dashboards tailored to your needs. This ensures that every decision you make is based on accurate, up-to-date data that truly reflects your operations.

Why Choose IoT/IIoT Implementation with IoT Industries?

Traditional companies typically specialize in OT (operational technologies, such as production lines and devices) or classic enterprise IT systems. However, we are able to connect both of these worlds. Our unique expertise in integrating OT and IT allows us to deliver innovative solutions in digital transformation, enhancing efficiency, reliability, and competitiveness for manufacturing companies.

Produktivita práce pod lupou 🔎 Odhaľte skryté straty vo vašej výrobe | Productivity Under the Microscope 🔎 Uncover Hidden Losses in Your Production

Productivity Under the Microscope 🔎 Uncover Hidden Losses in Your Production

At first glance, everything seems to be working as it should. Machines are running, people are working, orders are being fulfilled. You might feel that you’re already getting the most out of your available capacities—that this is the maximum your operation can deliver. But this is often where the greatest potential lies hidden.

Many companies today operate under the impression that they’re running at full capacity, while in reality, they may be losing tens of percent of their true potential. Losses hidden in minor downtimes, underutilized resources, or inefficient processes often go unnoticed because they aren’t visible at first glance. This is why labor productivity is crucial—not as an abstract concept, but as a concrete metric that shows where real improvements are possible.

Produktivita práce pod lupou 🔎 Odhaľte skryté straty vo vašej výrobe | Productivity Under the Microscope 🔎 Uncover Hidden Losses in Your Production

What is labor productivity and why should you start measuring it?

Labor productivity shows how much value your company can create in a given period. Whether it’s the number of units produced, completed orders, or the volume of services delivered, it always answers the same essential question: What is the output compared to the time, people, and technology required?

That’s why productivity is one of the most important indicators of efficiency. If it’s low, the company must invest more energy, time, and money to achieve the same result, which translates into higher costs, lower competitiveness, and weaker business outcomes. On the other hand, increasing productivity allows you to achieve more with what you already have—without unnecessary investment in new machines or the need to hire more people.

There are various ways to measure productivity. These include metrics such as GDP per employee, GDP per hour worked, output per worker, or machine utilization efficiency (OEE). The right metric depends on the type of production and the goals you aim to achieve.

Since proper measurement is the foundation of all improvement, we’ll cover this topic in more detail in a dedicated article, “How to Calculate Labor Productivity.”

Labor productivity in the EU and Slovakia

Looking at the numbers, Slovakia has long lagged behind the EU average in terms of labor productivity. According to Eurostat, the Slovak economy reaches only about 70 to 80% of the average labor productivity in the EU. This means the average Slovak worker produces less value per hour than their counterpart in Western Europe.

For manufacturing companies, this is not only a warning sign but also a huge opportunity. The productivity gap isn’t necessarily due to a lower quality workforce. More often, it’s the result of insufficient use of technology, a lack of automation, poor production planning, or missing reliable data for decision-making. Simply put, Slovak firms often work more, but achieve less.

Common problems in companies that don’t measure productivity

If a company doesn’t measure labor productivity or relies only on estimates, the same scenario tends to repeat itself. Production may be running, but results don’t match the effort. Everything might look fine on the surface, but beneath that, small inefficiencies accumulate into major losses.

❌ 1. Unclear Downtimes

Without precise measurement, no one knows exactly when and why machines stop, how long downtimes last, or what their real impact is. Planned, unplanned, and short downtimes are accepted as “just part of the job” instead of being systematically reduced or eliminated.

❌ 2. Rapidly Rising Costs Without Clear Cause

Unnecessary waiting, material waste, overproduction, inefficient production cycles, and reduced machine speeds all increase costs, even when no one seems to be doing anything wrong. If these losses aren’t tracked and analyzed, they can’t be identified, quantified, or strategically reduced.

❌ 3. Invisible Quality Losses

Without consistent measurement, only the biggest failures are reported, while smaller but frequent errors during startup or in-process often go unnoticed. These can add up to significant losses. If they aren’t tracked, they won’t be addressed—and remain hidden costs.

❌ 4. Lack of Transparency in Production Processes

If performance, downtimes, and other key data are recorded manually (on paper or in spreadsheets), the outputs are often inaccurate, delayed, and don’t reflect real-time conditions. There’s no clear view of what’s happening on the floor, making it hard to respond quickly. This lack of agility is a serious disadvantage today.

❌ 5. Ineffecient Reporting and Intuition-Based Decisions

Without reliable performance data, decisions are made based on estimates, experience, or gut feeling. The result is often poor planning, unbalanced workloads, unnecessary stress, and ultimately, increased losses.

These problems result in tangible long-term consequences:

  • Lower efficiency
  • Higher operating costs
  • Reduced competitiveness at home and abroad

How to increase productivity without unnecessary investments

The good news is that higher productivity doesn’t necessarily mean buying new machines, hiring more staff, or pushing people to work faster at the cost of quality. In many cases, it’s the opposite. The greatest impact often comes from better use of what you already have. The key is to know where losses arise, why they happen, and how to reduce or eliminate them.

✅ 1. Start by measuring productivity precisely

The foundation of improvement is accurate data. Without measurement, you can’t know where losses occur or how much they impact your performance. In many cases, productivity increases by 10 to 15% immediately after measurement begins—a phenomenon known as the “halo effect,” where people naturally perform better because they know their output is being tracked.

✅ 2. Automate data collection and eliminate manual errors

If you’re still recording downtimes, breakdowns, and other data manually, you’re leaving room for errors and delays. The solution is automated data collection from machines, production lines, and sensors, using IIoT systems or traditional SCADA/MES platforms. These provide real-time, accurate insights into what’s happening in production.

✅ 3. Focus on uncovering hidden losses

Wasted time, frequent interruptions, poor planning—these are common but often overlooked productivity killers. The “Six Big Losses” model helps categorize these losses into availability, performance, and quality. What makes this model powerful isn’t just naming the six main losses, but assigning clear reduction goals to each. Some can be eliminated completely, while others should be minimized.

✅ 4. Optimize production planning

When you have real-time visibility into machine capacities, line status, and resource availability, you can align production with actual demand—avoiding overloads and downtimes. Integrating MES with ERP or BI systems lets you manage production, maintenance, logistics, and inventory as a unified, data-driven process.

✅ 5. Use visualization and clear reporting

Data is only useful when it’s accessible and understandable. Interactive dashboards in tools like Ignition or Power BI give managers and line operators instant insights into production status, performance, and the root causes of downtime. These insights must be available not just at weekly meetings, but in real time and to everyone who needs them.

✅ 6. Make productivity improvement an ongoing effort

A common mistake is to treat productivity improvements as one-time projects. Successful companies know it’s a continuous process. Regular performance reviews, KPI tracking, and strategic adjustments help maintain improvements and adapt quickly to new challenges.

Labor productivity isn’t about making people work more, but about empowering them to work smarter. To reduce downtime, prevent overloads, and make decisions based on real data—not guesses. That’s why measuring productivity isn’t just another metric. It’s a tool for better decisions, sustainable growth, and a stronger operation.

A Custom Solution from IoT Industries

At IoT Industries, we help you gain precise insights into the performance of your machines and processes, uncover hidden losses, and set measurable goals for boosting productivity. We bring experience with automated data collection, SCADA, MES, OEE implementation, and more—so you can make decisions based on facts, not assumptions. Contact us to find out where your biggest improvement opportunities lie—and how to unlock them. Let’s take your production to the next level.

Why Choose IoT/IIoT Implementation with IoT Industries?

Traditional companies typically specialize in OT (operational technologies, such as production lines and devices) or classic enterprise IT systems. However, we are able to connect both of these worlds. Our unique expertise in integrating OT and IT allows us to deliver innovative solutions in digital transformation, enhancing efficiency, reliability, and competitiveness for manufacturing companies.

Ako Big Data pomáhajú šetriť náklady a zvyšovať výkon vo výrobných podnikoch | How Big Data Helps Reduce Costs and Increase Performance in Manufacturing Enterprises

How Big Data Helps Reduce Costs and Boost Performance in Manufacturing Enterprises

Manufacturing companies today face increasing pressure. They need to reduce costs, increase productivity, and simultaneously react flexibly to changing market conditions. The key to meeting these expectations and maintaining competitiveness is data. Every day, manufacturing companies generate huge amounts of data. While these data have the potential to significantly change the way businesses operate, in most cases, they remain unused. Not because they aren’t important, but because companies lack the tools to effectively collect, connect, analyze, and evaluate them.

Ako Big Data pomáhajú šetriť náklady a zvyšovať výkon vo výrobných podnikoch | How Big Data Helps Reduce Costs and Increase Performance in Manufacturing Enterprises

Does this sound familiar? If your company often relies more on estimates than on actual numbers, if decisions are made based on intuition instead of evidence, then it’s time to discover the true power of Big Data. This term doesn’t just represent a large volume of data. It refers to the ability to connect, process, visualize, and use data in everyday practice. From production planning, to maintenance management, to strategic business management. Big Data represents a way to turn hidden potential into real savings, higher performance, and overall better control over the business.

What Exactly Does the Term “Big Data” Mean?

Big Data refers to data streams that are generated in large volume, velocity, and variety. These are the so-called “3Vs” – Volume, Velocity, Variety. These data often come from dozens of different sources, arrive in different formats, and lack centralized management. It is this complexity that requires a completely different approach to processing, most often using specialized technologies, data-lake architectures, streaming protocols (e.g., MQTT), and analytical platforms such as Hadoop or Spark.

SCADA, MES, IoT – Essential Inputs to the Big Data Ecosystem

No Big Data solution works without reliable input, i.e., high-quality and continuous data collection from manufacturing devices and processes. This is where SCADA, MES, and IoT platforms like Ignition come into play. They are not Big Data systems themselves, but rather the foundational building blocks that provide data to the Big Data architecture.

In manufacturing, specialized industrial equipment and communication protocols are used, which typical IT systems cannot “read.” This is why SCADA and MES systems are so important. They serve as a bridge between operations and data analytics. They can collect data directly from machines, sensors, or production lines and transform them into useful information about performance, faults, or consumption, which can then be processed and utilized.

They can also aggregate data so that it can be sent safely and efficiently, either continuously (e.g., every second) or in batches (e.g., once an hour). This not only saves network capacity but also allows the use of this data in more advanced analytical tools.

When Do Big Data Solutions Truly Make Sense for a Business?

Big Data offer the most benefits when a company has already completed basic digitization and is starting to seek answers to more complex questions:

  • Where are the bottlenecks in production?
  • Which process parameter changes affect product quality?
  • Which faults can be predicted before a failure?
  • How can production be optimized across multiple facilities?

These are questions that require not just data, but their connection, context, and proper interpretation. In such cases, SCADA and MES systems become data feeders, while advanced analytics take place in specialized tools.

Not “Big Data Ready” Yet? No Problem.

Not every business needs to work with Big Data immediately. In many cases, significant progress can be made with simpler Business Intelligence solutions, such as combining Ignition + Power BI. This solution can already provide clear visualizations, reporting, and basic analysis across the entire production process.

However, if a business prepares for data work now – creates a consistent architecture, implements an IoT platform with quality data collection, uses standardized protocols (e.g., MQTT), and defines a “Single Source of Truth” – then Big Data will just be the next logical step, not a huge leap into the unknown.

How It Works in Practice

The transformation of data into value doesn’t happen overnight. But if you know how to do it, the results won’t take long to show. In a modern manufacturing business, everything begins with data collection from various devices. These data are collected in real time in systems like SCADA or MES, where they are processed, stored, and then integrated with other business systems.

In the next step, Business Intelligence comes into play. Tools like Microsoft Power BI and Ignition provide understandable visualizations and analytical reports. All key data is immediately available in interactive dashboards, enabling managers to make decisions based on accurate and up-to-date information.

In this way, a solid foundation for Big Data begins to be built. If the data is well-structured, properly labeled, and available in the correct format, it allows for smooth transition into advanced analytical tools and Big Data architectures.

IoT Industries: Your Guide to the Big Data Future

📌 We implement intelligent data collection across the entire production process.

📌 We integrate systems so that they communicate effectively with each other, creating a unified data ecosystem.

📌 Finally, we design tailor-made BI solutions that prepare data for further use in Big Data projects.

If you want to stop relying on intuition and start making decisions based on real data, Big Data is the ultimate goal. And we will help you reach it step by step. Don’t hesitate to contact us.

Why Choose IoT/IIoT Implementation with IoT Industries?

Traditional companies typically specialize in OT (operational technologies, such as production lines and devices) or classic enterprise IT systems. However, we are able to connect both of these worlds. Our unique expertise in integrating OT and IT allows us to deliver innovative solutions in digital transformation, enhancing efficiency, reliability, and competitiveness for manufacturing companies.

Optimalizácia výrobných procesov, ktorá prináša reálne výsledky | Manufacturing Process Optimization That Delivers Real Results

Manufacturing Process Optimization That Delivers Real Results

Manufacturing is changing faster than ever. A globalized market, fluctuating demand, rising costs, and increasing pressure on lead times and flexibility — all of this means that simply producing is no longer enough. You need to produce efficiently. Every unnecessary step, every underutilized resource, every inaccuracy in planning or maintenance leads to a loss of time, money, resources, reputation — and ultimately competitiveness.

Optimalizácia výrobných procesov, ktorá prináša reálne výsledky | Manufacturing Process Optimization That Delivers Real Results

What is the key to sustainable efficiency? It’s not about pushing people harder or investing in new technologies without a clear strategy. The key is optimizing your manufacturing processes. But this isn’t a one-time project — it’s a systematic approach that constantly identifies bottlenecks, uncovers hidden reserves, and transforms data into tangible improvements in real time. That’s what drives lower costs, higher productivity, and overall better performance across your operations.

Why does manufacturing process optimization often fail?

Many companies have tried to “streamline” production in the past. They’ve modernized machines, adjusted shifts, introduced KPIs… Yet problems persist. Delays continue, costs rise, competitiveness drops. Why?

Because without reliable data, it’s impossible to objectively identify where the problems arise, what causes them, or how to fix them. Optimization efforts often stop at the symptoms — not the root cause.

And that brings us to the most common reason why optimization fails: many manufacturers still work with inaccurate or incomplete data. Data is collected manually, reports arrive late, and the numbers often don’t add up. As a result, decisions are based on guesswork, gut feeling, or outdated templates — not current reality. And without real data, there can be no real optimization.

What does truly effective optimization look like?

Manufacturing process optimization isn’t just about doing things faster or cheaper. It’s a far more strategic and systematic effort. It means understanding the entire value stream — from the moment raw material enters your facility to the final shipping of finished goods. The goal is to identify and eliminate anything that doesn’t add value for the customer. In practice, this includes several key steps:

Gain complete and transparent visibility of your operations in real time. Because only with accurate, up-to-date data can you identify bottlenecks and make decisions based on facts, not assumptions.

Minimize all forms of waste. Whether it’s time, material, machinery, human capital, or energy — any waste represents untapped potential and unnecessary cost.

Optimize planning and production management. Instead of relying on ideal models or historical templates, you need to plan based on current priorities and real capacity — including staff, machines, and materials.

Shift from reactive to predictive and condition-based maintenance. That means using real-time data about the current technical state and performance of machines — not waiting until failures occur.

What role does digital transformation play in this?

Thanks to digital transformation, data is no longer collected manually — it’s gathered automatically, straight from machines, production lines, sensors, and measurement devices. These insights are immediately connected with other systems like ERP, warehouse management, maintenance, or quality control.

The result is a Single Source of Truth (SSOT) — a consistent and reliable data layer that every level of management can trust, from operators to the CEO.

But to make such complex data flows work as one cohesive ecosystem, you need the right tools. This is where modern digital solutions like SCADA, MES, or EMS come into play. These systems together create an interconnected, centralized environment where data can be collected, analyzed, and visualized across the entire production process — in real time, from one place.

With this approach, data is no longer buried in complex tables — it’s transformed into clear, interactive dashboards that instantly show material availability, equipment status, energy consumption, production progress, or deviations from the plan. No more waiting for weekly reports or gathering data from multiple departments — everything is available instantly, in one place.

When efficiency drops, equipment fails, or anomalies occur, management can respond immediately. Manufacturing optimization thus becomes a proactive management tool, not just reactive analysis. Companies can prevent issues before they escalate. And even more importantly, optimization becomes a continuous, data-driven improvement process — not a one-off initiative.

A tailored solution from IoT Industries

At IoT Industries, we believe that real manufacturing process optimization starts with accurate data and well-connected systems. We help manufacturing companies set up their entire data pipeline — from collection to visualization — so they can make smarter, faster, and more confident decisions.

If you want to identify exactly where your losses are and how to turn them into savings and performance gains, we’re here to help. Let’s talk.

Why Choose IoT/IIoT Implementation with IoT Industries?

Traditional companies typically specialize in OT (operational technologies, such as production lines and devices) or classic enterprise IT systems. However, we are able to connect both of these worlds. Our unique expertise in integrating OT and IT allows us to deliver innovative solutions in digital transformation, enhancing efficiency, reliability, and competitiveness for manufacturing companies.

Premeňte dáta na zisk – Microsoft Power BI mení rozhodovanie vo výrobných podnikoch | Turn Data into Profit – Microsoft Power BI Transforms Decision-Making in Manufacturing Businesses

Turn Data into Profit – Microsoft Power BI Transforms Decision-Making in Manufacturing Businesses

In today’s world, managing a company based solely on intuition and experience is no longer enough. Truly successful businesses rely on accurate data that enables them to make quick and informed decisions. However, many manufacturing companies still struggle with manual data collection, delayed and inaccurate reports, and inefficient processes. This costs them money, customers, and a competitive edge. But what if you could have all the essential information visually clear, up-to-date, and accessible with just a few clicks? That’s exactly what Business Intelligence (BI) offers, along with one of the most powerful tools on the market – Microsoft Power BI.

Premeňte dáta na zisk – Microsoft Power BI mení rozhodovanie vo výrobných podnikoch | Turn Data into Profit – Microsoft Power BI Transforms Decision-Making in Manufacturing Businesses

What Are the Most Common Problems Faced by Companies Without Modern Business Intelligence Tools Like Microsoft Power BI?

In most manufacturing companies, data is still collected manually. Workers record information on paper forms, which are then transcribed into spreadsheets at the end of the shift. Reports are generated daily or weekly from these spreadsheets, meaning management receives them with significant delays. Not only can such data be inaccurate or distorted, but if production issues arise, management learns about them too late to take timely action.

Without a unified data source, different departments often have conflicting views on the actual state of production. Sales teams might sell more than production can deliver, or the production team might overproduce, leading to excess inventory that ties up capital and remains unsold. There is no Single Source of Truth (SSOT) to consolidate all data into one system and eliminate inconsistencies between departments.

How Can MS Power BI Solve These Problems?

Power BI is Microsoft’s Business Intelligence tool that transforms raw data into clear, real-time insights and visualizations.

Unlike outdated manual methods, Microsoft Power BI collects, analyzes, and visualizes data automatically. By integrating with other systems such as ERP, SCADA, and MES, company leaders can monitor production performance, order status, and financial indicators at any time without waiting for manual reports. In case of production issues, managers gain instant insight into what happened.

MS Power BI also unifies data from various departments into a single central information source (SSOT). This ensures that everyone works with the same accurate data.

Why Power BI Alone Is Not Enough

Microsoft Power BI is a powerful tool, but the quality of its outputs depends on the quality of the input data. If data is incomplete, inaccurate, or delayed, even the best BI tool cannot enable effective decision-making. That’s why having a well-structured data collection and management system is crucial. This is where systems like SCADA and MES come into play, ensuring the automatic collection of precise data directly from production lines.

Comprehensive Custom Solution from IoT Industries

For Business Intelligence to deliver the desired results, it is essential to connect the right tools with high-quality data sources. IoT Industries offers a comprehensive solution. From setting up data flows and integrating Microsoft Power BI with MES and SCADA systems to creating custom interactive dashboards. The result is a system that provides accurate and up-to-date information necessary for efficient production management.

If you want to take your business decision-making to the next level, contact us. Discover how Power BI, combined with intelligent data collection, can transform your operations!

Why Choose IoT/IIoT Implementation with IoT Industries?

Traditional companies typically specialize in OT (operational technologies, such as production lines and devices) or classic enterprise IT systems. However, we are able to connect both of these worlds. Our unique expertise in integrating OT and IT allows us to deliver innovative solutions in digital transformation, enhancing efficiency, reliability, and competitiveness for manufacturing companies.

zber a analýza dát

BI Revolution – How business intelligence is changing decision-making in companies

Today, as companies face an increasingly fast pace of market changes and growing competition, the ability to make informed and accurate decisions is a key factor for success. Despite this, many companies still make decisions based on incomplete information, intuition, or personal preferences. Such an approach not only increases the risk of errors but also slows down responses to changes, significantly reducing competitiveness. This is precisely where Business Intelligence (BI) brings a revolution, fundamentally changing the way companies make decisions.

How does decision-making work without BI?

Imagine a company that still relies on manual data collection. Workers in production record the number of pieces produced, downtimes, or defects on paper forms, and at the end of the shift, this information is re-entered into Excel. It can then take several days for someone else to input it into the ERP (Enterprise Resource Planning) system, such as SAP. Even when the data finally makes it into the system, managers still do not have a complete picture of production performance.

Let’s say management finds out from the ERP system that during a work shift, the production line produced 1,000 pieces fewer than planned. Naturally, they want to find out why this happened. However, tracing the cause can take days or even weeks. Information on which part of the line caused the issue, who was operating it, or whether there was enough material or staff is not directly available in the ERP system. Management has to gather this information personally from employees, which further delays the process. Does this sound familiar?

This way of working is not only time-consuming but also prone to errors. Fatigue, inattention, or a misunderstanding of the situation can lead to inaccurate data. Additionally, some employees may be tempted to “embellish” the data to improve their performance or cover up problems that occurred during the shift. As a result, management is forced to make important decisions based on incomplete or skewed information. They often rely more on intuition or personal preferences, which can lead to inefficient processes, increased costs, and a decline in competitiveness.

Why is using a BI tool alone not enough?

It is also common for companies to have already implemented a business Intelligence tool, such as Microsoft Power BI. While it offers excellent capabilities for clear reports and visualizations, the main problem often lies not with the tool itself but with the data being fed into it. If the data is incomplete, inaccurate, or delayed, even the best BI tool cannot ensure high-quality, fast, and targeted decision-making.

How to ensure BI truly fulfills its purpose?

The implementation of modern systems, such as the industrial software platform Ignition, which we also use at IoT Industries, provides a solution that goes beyond simple data visualization. Ignition allows the automation of data collection directly from production equipment, minimizing the issues associated with manual data entry. For specific data that still requires manual input, the system offers electronic forms where workers can easily record this information. Ignition can also integrate data from various enterprise systems (ERP, SAP, MES, HR, quality, production, maintenance, warehouses, etc.) into one place for all relevant data – so-called Single Source of Truth (SSOT). This concept ensures that all data is accurate, available in real time, and serves as a comprehensive source of information for all management levels.

For instance, if a production issue arises, the shift supervisor can see what is happening in real-time and respond immediately. The production director can check the status of orders at any time, and even the CEO can review up-to-date financial indicators on a Friday afternoon without waiting for a report from their team. Everything is accurate, instantly accessible, and visualized in clear reports.

Benefits of BI for Companies

As you can see, the implementation of BI brings numerous benefits, which can be summarized into these five key advantages:

  1. Faster and More Informed Decision-Making: With access to up-to-date and accurate data, managers can make decisions faster and with greater confidence. They are no longer dependent on inaccurate or delayed reports and can respond to issues in real-time.
  2. Cost Reduction: Automating data collection and conducting precise analyses allow companies to identify inefficiencies in their processes. Whether it is unnecessary production downtime or incorrect resource planning, BI can detect and help eliminate these issues.
  3. Increased Productivity: Employees know that management has an accurate overview of everything happening. This simple fact increases productivity by approximately 10% even before any additional measures are taken.
  4. Prediction and Forecasting: Advanced BI systems can not only analyze past data but also predict future trends and needs. This means companies can better plan their capacities, orders, and optimize their resources.
  1. Improved Competitiveness: Companies that respond quickly to changes and base their decisions on accurate data gain a significant competitive advantage. Customers of such companies are also more satisfied because they have better insight into the status of their orders. This increases trust and competitiveness in the market.

Business Intelligence is now an integral part of modern companies. Tools like Ignition and Microsoft Power BI enable businesses to make decisions based on accurate, up-to-date, and comprehensive data. Transitioning from manual data collection and analysis to an automated system using BI brings immediate benefits—cost reduction, increased productivity, and enhanced competitiveness. For companies looking to keep pace with the times and respond quickly to market challenges, implementing BI is a key investment.

Why IoT Industries?

Traditional companies typically specialize in OT (operational technologies, such as production lines and equipment) or conventional enterprise IT systems. However, we are able to connect both these worlds. Our unique expertise in bridging OT and IT allows us to deliver innovative digital transformation solutions to clients, enhancing the efficiency, reliability, and competitiveness of manufacturing companies.