
What is work efficiency and why is it important for a manufacturing company?
Work efficiency expresses how effectively a company can transform available resources into a real result. In other words, it answers the question of how much value you can create from the resources you have available.
That is exactly why this indicator is so important. It does not simply tell you whether “work is being done,” but whether the work is being carried out in a way that makes economic and operational sense. From a management perspective, it is therefore not just an internal performance indicator. It is a direct factor that affects costs, the ability to meet deadlines, and the overall competitiveness of the company.
🔵 Work efficiency – calculation
The basic formula for calculating work efficiency is: Work efficiency = output / input
Output may represent the number of units produced, revenue, or completed tasks.
Input may be time, number of employees, or costs.
At first glance, this is a clear and logical formula that is used quite often. In practice, however, it is one of the most frequently misinterpreted indicators in manufacturing.
Imagine the following situation:
An operator produces 100 units in 8 hours.
After a process adjustment, they produce 120 units in the same amount of time.
According to the simple calculation, efficiency increased by 20%.
But this result says nothing about what is actually happening in the process. It does not take into account whether the machine was producing the whole time or had downtime, whether it was operating at maximum performance, or what portion of the output had real value. It also fails to capture the actual potential of the equipment, that is, whether under ideal conditions it could have produced 160 units instead of 120.
And this is where the biggest problem arises. Work efficiency is very often evaluated without context. And numbers without context are, at best, inaccurate, and at worst, misleading.
What actually affects work efficiency?
If you want to understand work efficiency correctly, it is not enough to see it as a single number. In reality, it is a combination of several factors that together create the overall picture of production performance.
➡️ Actual production time
The first key factor is the time during which production is actually taking place. Not planned time, but the real time when the company is producing value. In reality, almost no production runs continuously. There is downtime, whether planned, such as changeovers or maintenance, or unplanned, caused by failures, waiting for material, or waiting for an operator. Every such interruption means a loss that does not appear at all in a simple efficiency calculation. The result is a situation in which the company appears busy, but in reality produces only during part of the available time.
➡️ Actual performance compared to the ideal
The second factor is actual performance compared to the ideal state. Even when a machine is running, it may not be operating at its maximum potential. It may run more slowly than its technical parameters allow, or its performance may decrease due to wear, incorrect settings, or inefficient operation. This type of loss is especially dangerous because it is not visible at first glance. Production is running, the numbers are growing, but actual performance is falling short of what could be achieved. The difference between actual and ideal performance therefore represents one of the greatest sources of unused potential in manufacturing.
➡️ Output quality
The third factor is output quality. Work efficiency is not only about quantity, but also about how much of the produced volume has real value. If part of the production does not meet requirements, it has to be reworked or scrapped entirely. That means that time, energy, and capacity were indeed used, but did not deliver the expected result. In that case, the production volume may look satisfactory, but actual efficiency declines.
Only the combination of these three factors – actual production time, actual performance, and quality – provides a complete picture of how efficiently production is operating. If even one of them is missing, the resulting number stops reflecting reality and becomes more of an indicative estimate than a reliable basis for decision-making.
How is work efficiency measured in practice?
If we want not only to understand work efficiency, but also to manage it, we must be able to measure it specifically. In practice, however, there is no single universal indicator that fits every company and every situation. Different types of calculations, from simple operational metrics to complex indicators, answer different questions, and each has its own limitations.
👷 Productivity per employee or per hour worked
The most basic approach is measuring labor productivity per employee or per hour worked. It is a simple ratio between output and input that is often used as an initial indicative metric.
Imagine a production operation where five employees produce a total of 2,000 units during an eight-hour shift. In that case, productivity per employee comes to 400 units per shift. If we convert this result into time, we get productivity of approximately 50 units per hour worked.
2,000 units / 5 employees = 400 units per shift
2,000 units / (5 employees × 8 hours) = 50 units per hour worked
This type of calculation is fast, clear, and especially useful where human labor plays the dominant role. Its major disadvantage, however, is that it ignores the technological reality of production. It does not take downtime into account, does not see the difference between slow and optimal equipment performance, and cannot work with output quality. The result is a number that may look precise, but does not speak to the actual efficiency of the process.
💵 Productivity expressed as value created
At a higher level, indicators based on value created are used, such as productivity expressed as value added per employee or per hour worked. This approach is typical especially for economic analyses, where the focus is on how much value a company can create from its available resources.
If a company creates €3,000,000 in value annually and has 60 employees, productivity per employee is €50,000 per year. And if the employees work a total of 96,000 hours, then productivity per hour is €31.25.
€3,000,000 / 60 employees = €50,000 annually per employee
€3,000,000 / 96,000 hours = €31.25 per hour
The difference between productivity per employee and productivity per hour worked is significant. While productivity per employee can be influenced, for example, by organizational structure, productivity per hour worked goes deeper and better reflects actual work performance. That is why it is considered a more accurate indicator. Even these indicators, however, cannot capture the most important thing, namely what is happening directly on the shop floor.
⚙️ OEE as the most practical indicator in manufacturing
In an industrial environment, efficiency is not created only at the level of people, but above all at the level of equipment. And that is precisely why OEE (Overall Equipment Effectiveness), or overall equipment efficiency, is used as a key indicator.
OEE is based on the principle we explained earlier. It tracks three core areas – availability, performance, and quality. These three key factors are combined into a single figure that shows what share of its maximum potential the equipment is actually utilizing.
If, during the shift, the equipment does not run for part of the planned time, its availability decreases. If it runs, but more slowly than its parameters allow, it loses performance. And if it produces defects, quality decreases. Each of these losses is multiplied, which means that even relatively small deviations have a significant impact on the overall result.
Imagine equipment with 85% availability, 90% performance, and 95% quality. At first glance, that looks very good. But the resulting OEE is 73%. That means that more than one quarter of the production potential remains unused.
And that is where the power of OEE lies. Unlike simple calculations, it does not only show the result, but also helps reveal its cause. It makes it possible to precisely identify whether efficiency is declining بسبب downtime, reduced performance, or quality defects. That is why it becomes not only an analytical tool, but above all a practical production management tool.
Why is the calculation alone not enough?
This brings us to the most important point of the entire article. Even the best indicator will not help you if it is based on bad data. The work efficiency calculation itself is only a tool. Its value always depends on the data it is based on. It is often the case that even companies that measure efficiency work with incomplete, delayed, or distorted data. The result is a situation in which even a sophisticated indicator looks trustworthy, but in reality does not reflect the actual state of production.
✅ Quality data as the foundation of real efficiency
If measuring work efficiency is to have real meaning, it must be built on data that is collected directly in production, automatically, accurately, and in real time.
That means three fundamental things. First, data collection must not depend on manual recording, which is naturally prone to errors and delays. Second, data from production, maintenance, warehouse, quality, and sales must be interconnected so that the company works with one version of reality (the so-called Single Source of Truth), not several parallel interpretations. And third, information must be available continuously, not only at the end of the shift or in a weekly report.
This is what creates the difference between estimated efficiency and managed efficiency.
✅ Loss identification
Once you have quality data available, the second key step is to understand where efficiency is actually leaking away. This is what the Six Big Losses model is for, one of the most widely used approaches in modern production management. It divides losses into six main categories and helps identify them precisely.
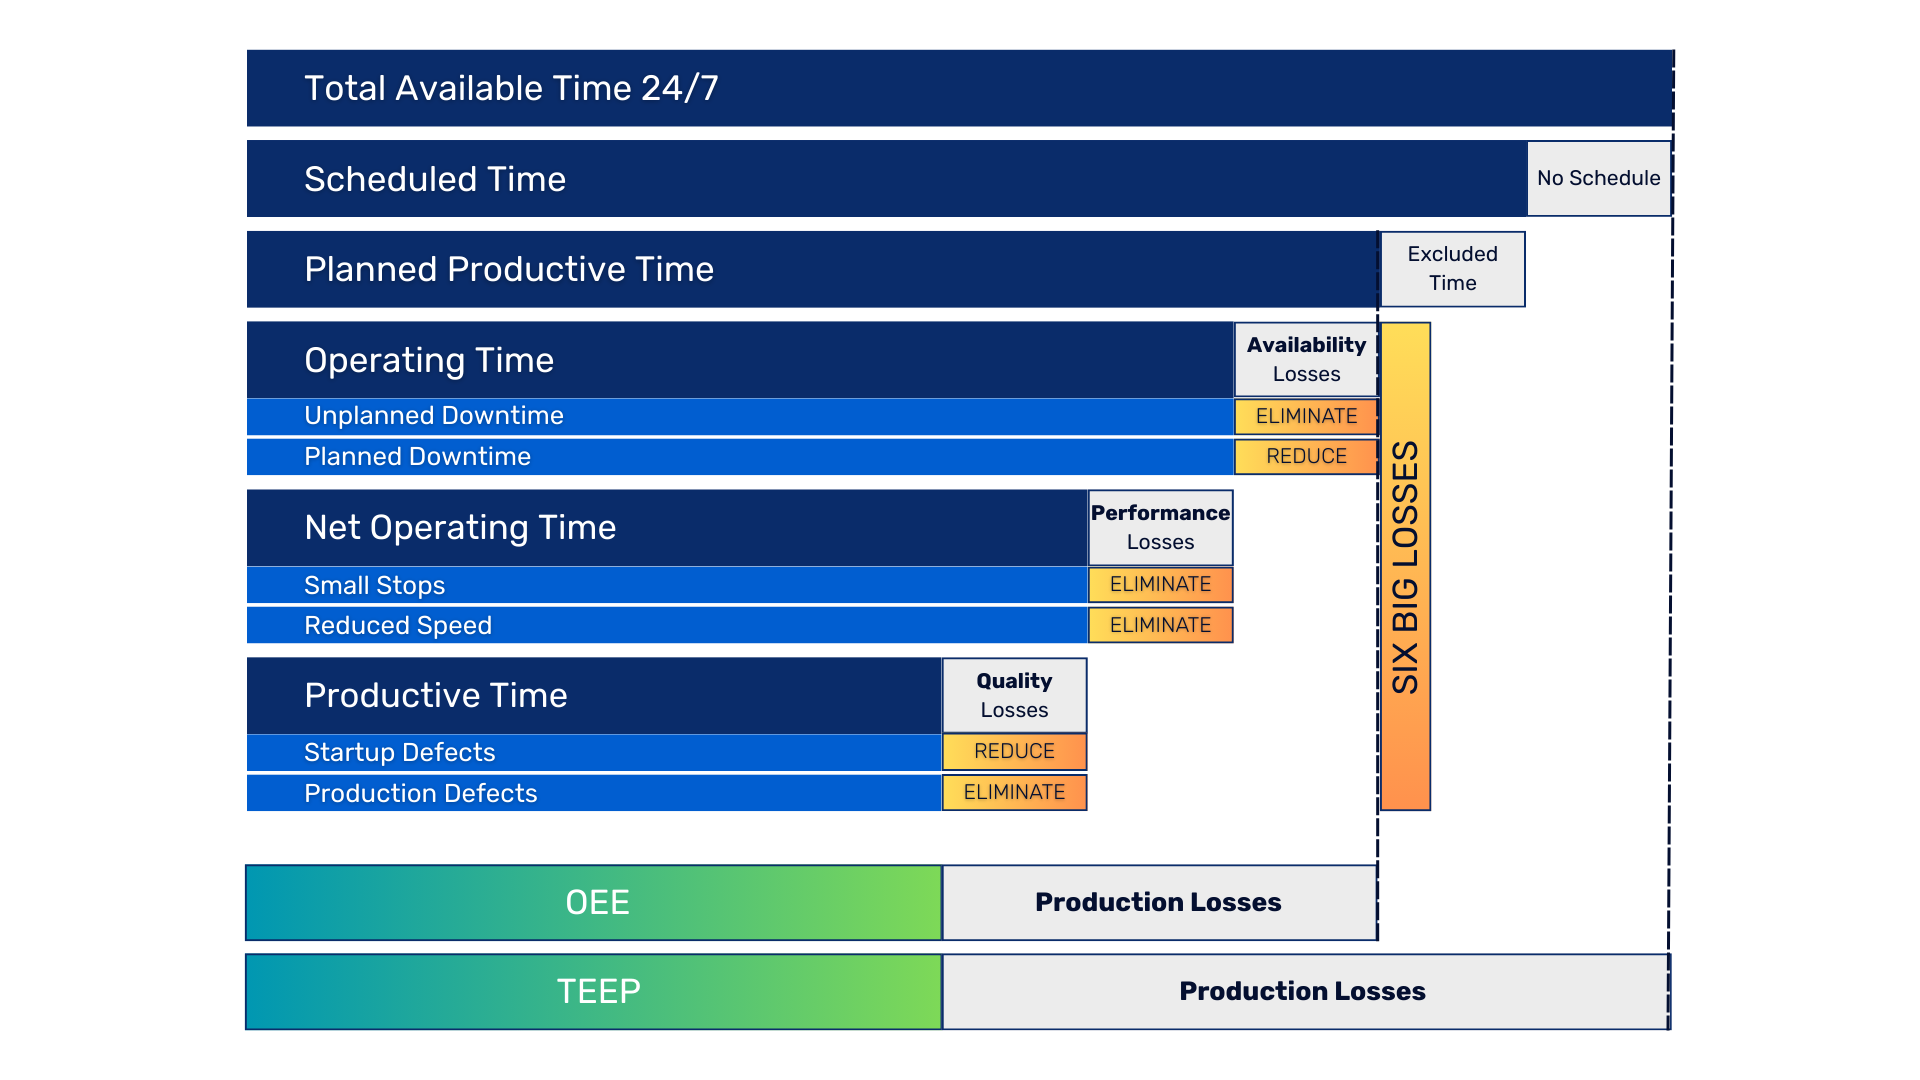
With the Six Big Losses model, the point is not to memorize all six categories. What matters is understanding the principle. Efficiency is not lost in one major problem. It is lost in dozens of smaller situations that repeat every day. The model helps not only to identify these losses, but also to assign them a specific goal, whether that means eliminating them completely or at least reducing them significantly.
In combination with accurate data, improving efficiency thus stops being a random process and becomes a managed activity. The company knows exactly where losses arise, what their impact is, and which ones make sense to address first.
✅ A continuous process of improving efficiency
But even identifying losses alone is not enough. Data without action has no value. The key is to know how to act based on it, then evaluate the result and act again. In practice, this means that the company not only identifies a problem (for example, frequent downtime), but also implements a specific measure, tracks its impact, and adjusts it based on the result. And this cycle repeats continuously.
Work efficiency is therefore not improved by one single decision, but by a series of small, systematic steps. Every improvement needs to be verified by data. Every decision must have feedback. And it is precisely this cycle – act, evaluate, adjust, and act again – that distinguishes companies that merely monitor efficiency from those that can manage and improve it over the long term.
5 practical steps to higher efficiency
1️⃣ Identify the problem
The first step is not to look for a solution, but to understand the problem. In many companies, there are multiple areas where losses occur, but not all of them have the same impact. That is why it is important to focus on those that affect performance the most. Typically, these are frequent equipment downtime, reduced production line performance, or recurring production errors. The goal is not to analyze everything at once, but to identify one specific area where improvement has the greatest potential.
2️⃣ Start with a pilot project
Instead of trying to change the entire company at once, focus on one line, one machine, or one process. A pilot project allows you to set the right method of collecting and evaluating data, verify the benefits of the solution in real conditions, and identify potential issues before rolling it out further. This step significantly reduces risk while also delivering quick initial results that can convince other parts of the organization.
3️⃣ Set up the data architecture
If data is to have real value, it must be accurate, connected, and available at the right time. In practice, this means automated data collection directly from equipment, integration of production, maintenance, quality, and other systems, and a unified data structure that ensures consistent evaluation. Without this foundation, efficiency may be “measured,” but it will not be possible to manage it reliably.
4️⃣ Launch measurement and evaluation
Data collection is only the beginning. Real value arises only when the data begins to be actively used. At this stage, it is important to regularly monitor key indicators, identify deviations and their causes, and then take specific measures to eliminate them. Every measure should have a clear objective and measurable impact. Only then is it possible to objectively evaluate whether the change delivered the expected result.
5️⃣ Scale the solution
Once the pilot project proves its results, it is time to expand it. At that point, the company already knows what works and what does not, has processes and a data structure in place, and has concrete results on which to build. The solution can then gradually be extended to additional lines, operations, or the entire company.
