Produktivita práce pod lupou 🔎 Odhaľte skryté straty vo vašej výrobe | Productivity Under the Microscope 🔎 Uncover Hidden Losses in Your Production

Productivity Under the Microscope 🔎 Uncover Hidden Losses in Your Production

At first glance, everything seems to be working as it should. Machines are running, people are working, orders are being fulfilled. You might feel that you’re already getting the most out of your available capacities—that this is the maximum your operation can deliver. But this is often where the greatest potential lies hidden.

Many companies today operate under the impression that they’re running at full capacity, while in reality, they may be losing tens of percent of their true potential. Losses hidden in minor downtimes, underutilized resources, or inefficient processes often go unnoticed because they aren’t visible at first glance. This is why labor productivity is crucial—not as an abstract concept, but as a concrete metric that shows where real improvements are possible.

Produktivita práce pod lupou 🔎 Odhaľte skryté straty vo vašej výrobe | Productivity Under the Microscope 🔎 Uncover Hidden Losses in Your Production

What is labor productivity and why should you start measuring it?

Labor productivity shows how much value your company can create in a given period. Whether it’s the number of units produced, completed orders, or the volume of services delivered, it always answers the same essential question: What is the output compared to the time, people, and technology required?

That’s why productivity is one of the most important indicators of efficiency. If it’s low, the company must invest more energy, time, and money to achieve the same result, which translates into higher costs, lower competitiveness, and weaker business outcomes. On the other hand, increasing productivity allows you to achieve more with what you already have—without unnecessary investment in new machines or the need to hire more people.

There are various ways to measure productivity. These include metrics such as GDP per employee, GDP per hour worked, output per worker, or machine utilization efficiency (OEE). The right metric depends on the type of production and the goals you aim to achieve.

Since proper measurement is the foundation of all improvement, we’ll cover this topic in more detail in a dedicated article, “How to Calculate Labor Productivity.”

Labor productivity in the EU and Slovakia

Looking at the numbers, Slovakia has long lagged behind the EU average in terms of labor productivity. According to Eurostat, the Slovak economy reaches only about 70 to 80% of the average labor productivity in the EU. This means the average Slovak worker produces less value per hour than their counterpart in Western Europe.

For manufacturing companies, this is not only a warning sign but also a huge opportunity. The productivity gap isn’t necessarily due to a lower quality workforce. More often, it’s the result of insufficient use of technology, a lack of automation, poor production planning, or missing reliable data for decision-making. Simply put, Slovak firms often work more, but achieve less.

Common problems in companies that don’t measure productivity

If a company doesn’t measure labor productivity or relies only on estimates, the same scenario tends to repeat itself. Production may be running, but results don’t match the effort. Everything might look fine on the surface, but beneath that, small inefficiencies accumulate into major losses.

❌ 1. Unclear Downtimes

Without precise measurement, no one knows exactly when and why machines stop, how long downtimes last, or what their real impact is. Planned, unplanned, and short downtimes are accepted as “just part of the job” instead of being systematically reduced or eliminated.

❌ 2. Rapidly Rising Costs Without Clear Cause

Unnecessary waiting, material waste, overproduction, inefficient production cycles, and reduced machine speeds all increase costs, even when no one seems to be doing anything wrong. If these losses aren’t tracked and analyzed, they can’t be identified, quantified, or strategically reduced.

❌ 3. Invisible Quality Losses

Without consistent measurement, only the biggest failures are reported, while smaller but frequent errors during startup or in-process often go unnoticed. These can add up to significant losses. If they aren’t tracked, they won’t be addressed—and remain hidden costs.

❌ 4. Lack of Transparency in Production Processes

If performance, downtimes, and other key data are recorded manually (on paper or in spreadsheets), the outputs are often inaccurate, delayed, and don’t reflect real-time conditions. There’s no clear view of what’s happening on the floor, making it hard to respond quickly. This lack of agility is a serious disadvantage today.

❌ 5. Ineffecient Reporting and Intuition-Based Decisions

Without reliable performance data, decisions are made based on estimates, experience, or gut feeling. The result is often poor planning, unbalanced workloads, unnecessary stress, and ultimately, increased losses.

These problems result in tangible long-term consequences:

  • Lower efficiency
  • Higher operating costs
  • Reduced competitiveness at home and abroad

How to increase productivity without unnecessary investments

The good news is that higher productivity doesn’t necessarily mean buying new machines, hiring more staff, or pushing people to work faster at the cost of quality. In many cases, it’s the opposite. The greatest impact often comes from better use of what you already have. The key is to know where losses arise, why they happen, and how to reduce or eliminate them.

✅ 1. Start by measuring productivity precisely

The foundation of improvement is accurate data. Without measurement, you can’t know where losses occur or how much they impact your performance. In many cases, productivity increases by 10 to 15% immediately after measurement begins—a phenomenon known as the “halo effect,” where people naturally perform better because they know their output is being tracked.

✅ 2. Automate data collection and eliminate manual errors

If you’re still recording downtimes, breakdowns, and other data manually, you’re leaving room for errors and delays. The solution is automated data collection from machines, production lines, and sensors, using IIoT systems or traditional SCADA/MES platforms. These provide real-time, accurate insights into what’s happening in production.

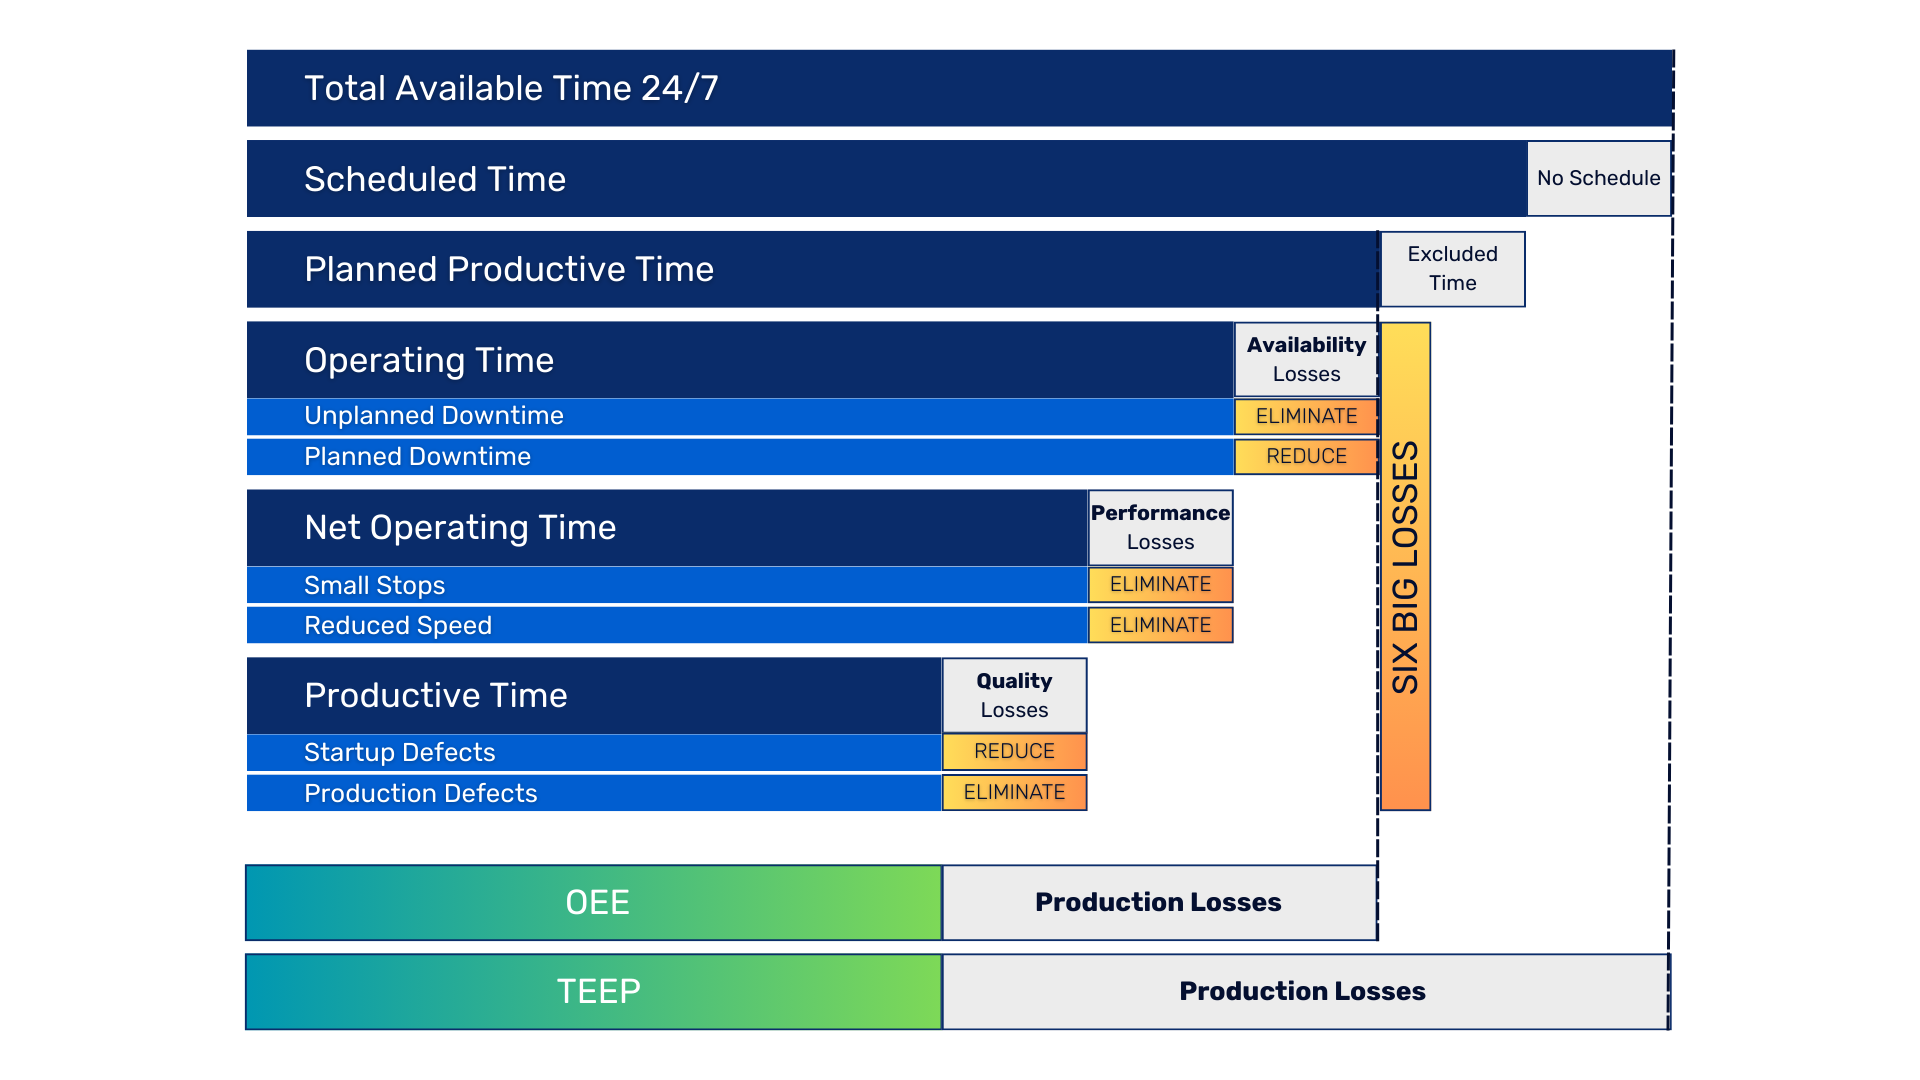
✅ 3. Focus on uncovering hidden losses

Wasted time, frequent interruptions, poor planning—these are common but often overlooked productivity killers. The “Six Big Losses” model helps categorize these losses into availability, performance, and quality. What makes this model powerful isn’t just naming the six main losses, but assigning clear reduction goals to each. Some can be eliminated completely, while others should be minimized.

✅ 4. Optimize production planning

When you have real-time visibility into machine capacities, line status, and resource availability, you can align production with actual demand—avoiding overloads and downtimes. Integrating MES with ERP or BI systems lets you manage production, maintenance, logistics, and inventory as a unified, data-driven process.

✅ 5. Use visualization and clear reporting

Data is only useful when it’s accessible and understandable. Interactive dashboards in tools like Ignition or Power BI give managers and line operators instant insights into production status, performance, and the root causes of downtime. These insights must be available not just at weekly meetings, but in real time and to everyone who needs them.

✅ 6. Make productivity improvement an ongoing effort

A common mistake is to treat productivity improvements as one-time projects. Successful companies know it’s a continuous process. Regular performance reviews, KPI tracking, and strategic adjustments help maintain improvements and adapt quickly to new challenges.

Labor productivity isn’t about making people work more, but about empowering them to work smarter. To reduce downtime, prevent overloads, and make decisions based on real data—not guesses. That’s why measuring productivity isn’t just another metric. It’s a tool for better decisions, sustainable growth, and a stronger operation.

A Custom Solution from IoT Industries

At IoT Industries, we help you gain precise insights into the performance of your machines and processes, uncover hidden losses, and set measurable goals for boosting productivity. We bring experience with automated data collection, SCADA, MES, OEE implementation, and more—so you can make decisions based on facts, not assumptions. Contact us to find out where your biggest improvement opportunities lie—and how to unlock them. Let’s take your production to the next level.

Why Choose IoT/IIoT Implementation with IoT Industries?

Traditional companies typically specialize in OT (operational technologies, such as production lines and devices) or classic enterprise IT systems. However, we are able to connect both of these worlds. Our unique expertise in integrating OT and IT allows us to deliver innovative solutions in digital transformation, enhancing efficiency, reliability, and competitiveness for manufacturing companies.

OEE – Myslíte si, že vaša výroba funguje na 100 %? Možno prichádzate až o 50 % potenciálu! | OEE – Do You Think Your Production Is Running at 100%? You Might Be Losing Up to 50% of Its Potential!

OEE – Do You Think Your Production Is Running at 100%? You Might Be Losing Up to 50% of Its Potential!

In many manufacturing companies, everything seems to be running smoothly at first glance. Machines are running, workers are working, and the production plan appears to be on track. Management believes that the business is operating at 100% simply because they’ve gotten used to calling this their maximum. But the reality can be quite different. Not because something visibly isn’t working, but because no one realizes that it could work much better. The company may have a hidden potential that remains untapped.

OEE – Myslíte si, že vaša výroba funguje na 100 %? Možno prichádzate až o 50 % potenciálu! | OEE – Do You Think Your Production Is Running at 100%? You Might Be Losing Up to 50% of Its Potential!

Today, the winner in manufacturing is not the one with more machines or a larger workforce. The winner is the one who can maximize the use of the resources already available. And that’s exactly the essence of the OEE – Overall Equipment Effectiveness indicator. It’s one of the most important tools for managing production performance, capable of uncovering where a company’s hidden potential lies. More importantly, it enables this potential to be converted into tangible results.

What Is OEE and What Does It Measure?

OEE is a quantitative indicator of a machine’s overall effectiveness. It measures how efficiently a machine actually operates compared to its full potential, by considering three critically important components: availability, performance, and quality.

  • Availability shows how much time the machine was actually producing compared to how much time it was scheduled to produce.
  • Performance indicates whether the machine produced the expected number of units in the actual production time, based on the ideal cycle time.
  • Quality measures the ratio of defect-free products to total output.

Each of these dimensions is expressed as a percentage, and the final OEE value is the product of these three percentages. In practice, this means that even if each individual component is relatively high, the combined effect may still reveal significant losses.

Example:
If a machine had 100% availability (ran for the full 8 hours) and 100% performance (produced the expected number of pieces), but only 50% of the products met quality standards, the resulting OEE would be just 50%.
Because 100% x 100% x 50% = 50%

OEE is also commonly used as a core metric in methodologies such as Downtime Management, Lean Manufacturing, Six Sigma, or Kaizen.

What Does the Final OEE Value Really Tell Us?

OEE acts like a diagnostic tool, similar to a thermometer. It won’t fix the problem by itself but helps identify it. The final OEE value is above all an indicator of where the company has room for improvement.

  • If availability is low, it’s time to analyze downtime.
  • If performance is poor, focus on optimizing production cycles.
  • If quality is lacking, investigate causes of defects.

Many companies assume they’re running at 90–100%, simply because production appears to be moving. But this subjective perception often hides a harsher reality. Real-world data often reveals that OEE is around 50–60%. In some cases, it’s as low as 45%, meaning more than half of the machine’s potential goes unused.
On the other hand, the “World Class” level of OEE is around 85%, which is already exceptional in many sectors. And the gap between these two levels represents a huge improvement opportunity.

It’s easy to “create” perfect numbers – by setting low production targets or ignoring true cycle times. When data is collected manually, it’s not unusual to see inflated values like 97–98%, which reflect a convenient plan, not actual performance.

Sometimes, with a poorly defined goal and only 50% availability, a company can “achieve” an OEE of over 130%. This is obviously methodologically incorrect.
Only if the cycle times reflect the real mechanical capabilities of the equipment and data collection is accurate, can OEE be a reliable indicator.

What Comes After Measuring OEE?

With a well-configured data collection system, the application itself can identify most of the specific reasons for reduced efficiency:

  • Why is the machine not running?
  • How many minutes per day are lost to short stoppages?
  • How often does material run out?
  • Which breakdowns occur most frequently?

All of this can be monitored in real-time and easily evaluated using clear reports. These reports reveal where the biggest losses occur – whether in terms of time or costs – and give management a solid basis for corrective actions.

Just like with IoT solutions, the goal isn’t to collect data. The goal is to act on it. That’s why we use the Six Big Losses model.

The Six Big Losses Model

This model categorizes losses into three groups, each linked to one of the three OEE components:

  1. Availability Losses
    • Unplanned Downtime: machine failures, missing materials, unexpected maintenance
    • Planned Downtime: changeovers, scheduled maintenance, cleaning
  2. Performance Losses
    • Short Stops: brief downtimes typically under one minute
    • Reduced Speed: when a machine runs slower than its optimal rate
  3. Quality Losses
    • Startup Defects: errors during machine warm-up
    • Production Defects: non-conforming products during normal operation

What makes this model powerful is not just naming the six major loss types, but also assigning a specific goal for their elimination.

  • Some losses (e.g., unplanned downtime, short stops, speed losses, process defects) can and should be eliminated entirely.
  • Others (like changeovers or startup errors) can at least be minimized.

This structure helps businesses not only define problems but also set realistic and measurable goals – resulting in a much more systematic improvement process.

six big losses

OEE as a Practical Tool, Not Just a Metric

One of the biggest strengths of OEE is its ability to challenge gut feelings with facts. It replaces assumptions with data, emotions with numbers, and “we think we’re efficient” with measurable reality. It exposes hidden machine capacity, which often remains unused simply because no one is tracking it.

With OEE, performance becomes something that can be measured, managed, and improved. It’s not just a metric – it’s a transformational tool.

✅ OEE Increases by 10–15% Right After Implementation

Simply starting to measure – without any other changes – often leads to a dramatic shift in behavior. It boosts discipline, reduces unnecessary downtime, and makes time usage more efficient. This “halo effect” typically results in an immediate OEE boost of 10 to 15%.
Not because the technology changed – but because awareness did.

✅ A Key Milestone on the Road to Digital Transformation

OEE is also an essential step toward digitalizing production.
It replaces paper forms, messy spreadsheets, and imprecise guesses with automated data collection, instantly available real-time reports, and a whole new level of management insight.

Companies that adopt OEE gain continuous visibility into performance – at the level of specific machines, lines, and operations.

✅ Immediate Response to Any Issue

With OEE, data is no longer a historical snapshot – it becomes a daily decision-making tool.
If management sees that a machine loses an hour each shift due to lack of materials, they can act. Maybe the issue is delayed warehouse communication. By adding a simple feature – such as an automatic alert when material drops below 10% – the downtime can be reduced from 60 minutes to just 5.

Not next week. Not after a meeting. But the next day. That’s the power of real-time data.

✅ A Continuous Optimization Process

OEE isn’t just analysis – it’s action.
Everyone from operators to managers has live access to what’s really happening. They know what changed, what worked, and what needs further adjustment. This transforms improvement from a one-off project to a continuous optimization process, built not on guesses, but on data.

✅ Savings of Tens or Hundreds of Thousands of Euros, ROI Within Months

Perhaps most importantly, OEE increases output without needing new machines.
A 25% OEE improvement across 20 machines can achieve the same output gain as buying five new machines, saving tens to hundreds of thousands of euros.

Thanks to the flexible licensing of Ignition software, the return on investment in OEE is often just a few months to a year. And from that point on, the system pays for itself.

Tailor-made end-to-end solution by IoT Industries

OEE is not just a number. It’s a tool for smarter production management – one that connects data, people, and decisions into a single, efficient system. And that’s exactly what modern manufacturing is about – not just producing, but producing effectively.

At IoT Industries, we’re ready to help you with a complete OEE implementation – from data collection to visualization.
Get in touch with us today.

Why Choose IoT/IIoT Implementation with IoT Industries?

Traditional companies typically specialize in OT (operational technologies, such as production lines and devices) or classic enterprise IT systems. However, we are able to connect both of these worlds. Our unique expertise in integrating OT and IT allows us to deliver innovative solutions in digital transformation, enhancing efficiency, reliability, and competitiveness for manufacturing companies.