Čo sú prevádzkové náklady? Ako ich vypočítať, správne merať a efektívne znižovať? | What are operating costs? How to calculate them, measure them properly and reduce them effectively?

What are operating costs? How to calculate them, measure them properly and reduce them effectively?

At the end of the month, the invoices land on your desk and you see that production cost more than you expected. The total amount is clear, but it does not tell you which line, which shift or which product drove it up. Operating costs can only be used for decision-making once you can relate them to what you produced and sold in the same period. A calculation based on data measured directly on the shop floor will help you do this, and it will also show you where costs can be reduced.
Čo sú prevádzkové náklady? Ako ich vypočítať, správne merať a efektívne znižovať? | What are operating costs? How to calculate them, measure them properly and reduce them effectively?

What are operating costs?

Production runs every day, and every day something costs you money. You have to pay for the hall, people’s work, consumed materials and energy, as well as for regular maintenance and machine repairs. Operating costs are exactly these ongoing costs of running the business over a given period, such as a month, a quarter or a year. They are also called operating expenses, and you will often come across the abbreviation OPEX. If you only know them as one total for the whole company, you know how much you spent, but not where and why.

A company buys a new press. The purchase itself is a capital expenditure, abbreviated as CAPEX, meaning a one-off expenditure on an asset that serves the company for years. Such an investment enters costs gradually through depreciation, which is the part of the asset’s price that the company charges to costs for each year of its use. An expensive machine therefore does not burden the results of a single month with its full price, but with a small amount over many years. The operator’s wages, the electricity the press consumes and its regular maintenance, on the other hand, are operating costs.

What is included in operating costs in manufacturing?

When you break down monthly production costs, you will find that they consist of six groups. For each of them, it is worth knowing how it behaves when production volume changes and whether you can assign it to a specific product. Variable costs rise and fall with the number of units produced, while you pay fixed costs in the same amount during both full and weaker production. Direct costs can be assigned to a specific product or order, while indirect costs, also called overhead, serve several products at once and are allocated among them.

Cost groupWhat it includesFixed / variableDirect / indirect
Material consumptionRaw materials, semi-finished products and packagingVariableDirect
Auxiliary materialsVariableIndirect
EnergyElectricity and compressed air for running machinesVariableIndirect
Heating, ventilation and lighting of the hallFixedIndirect
Personnel costsOperators’ wages and social contributionsFixed in the short termDirect
Wages and social contributions of supervisors, maintenance, warehouse and administration staffFixedIndirect
Maintenance and repairsRegular machine servicingFixedIndirect
Repairs after breakdowns and spare partsMostly fixedIndirect
Rent, insurance, services and feesHall rent and insuranceFixedIndirect
External services, such as cleaning and transportMostly fixedIndirect
Taxes and feesFixedIndirect
DepreciationThe part of a capital expenditure charged to costs for the yearFixedIndirect

What, on the other hand, is not included in operating costs?

Operating costs do not include the purchase of a machine, a hall or any other long-term asset, because that is an investment. Similarly, an upgrade that increases a machine’s performance is usually an investment. Nor do they include interest on loans and income tax, which are reported separately in the income statement. Interest relates to the way the company finances its operations, not to what production itself costs. If you added it to operations, two halls working equally well would appear to have different costs just because of one hall’s loan.

How to calculate operating costs step by step

➡️ Total operating costs for the period

We will demonstrate the calculation using a model medium-sized manufacturing company for one month. The first step is to add up all groups of operating costs for the same period.

ItemAmount per month
Material consumption€210,000
Energy€38,000
Personnel costs€96,000
Maintenance and repairs€14,000
Rent, insurance, services and fees€22,000
Depreciation€20,000
Total operating costs€400,000

From the table, you can see that running the company cost €400,000 for the month and that materials account for more than half. This shows you which group has the greatest impact on the result. However, the total alone does not tell you whether this is a lot or a little. A month in which you produced more will naturally be more expensive, and that does not necessarily mean worse performance. The boundary of the period can also mislead you, for example when an energy invoice arrives late and is recorded in the wrong month. That is why you should always relate the total to what was produced and sold in the same period.

➡️ Operating costs as a share of revenue

The first ratio is the share of revenue, which shows what part of the money earned is consumed by running the business itself.

Operating costs as a share of revenue = operating costs / revenue × 100

The model company generated €460,000 in revenue for the month.
€400,000 / €460,000 × 100 = 86.96%, rounded to 87%

The result means that approximately 87 cents of every euro of revenue goes to operations. Interest and income tax are still paid out of the remaining approximately 13 cents, and only then is there a profit. This indicator is most valuable when you track it month by month. If it rises, operations are becoming more expensive faster than revenue is growing, and it is time to look for the cause. However, the selling price also changes the share. If you raise product prices, it drops, even though nothing has changed in the hall. The share of revenue therefore shows that something is happening, but it still does not tell you where the cause lies.

➡️ Operating costs per good unit

Closer to production is the calculation per unit. It shows how much operating cost falls on each product you can sell.

Operating costs per unit = operating costs for the period / number of good units

The model company produced 82,000 units in the month. Of these, 2,000 failed inspection, so 80,000 are good.
€400,000 / 82,000 pcs = €4.88 per unit produced
€400,000 / 80,000 pcs = €5.00 per good unit

Defective units consumed material, energy and machine time, but cannot be sold, so their costs are spread across the good units. If you divide by all units produced, production looks cheaper than it really is. The result can mislead you if you produce several types of products. The amount of €5.00 is an average for the whole company, in which a simple part and a complex part come out as equally expensive. A company-wide average is therefore suitable for tracking trends over time, not for creating a price list.

➡️ Machine hour cost

The last calculation goes down to the level of a single machine. The machine hour rate tells you how much one hour of machine production costs, and it is used when pricing orders.

Machine hour cost = annual fixed costs of the machine / annual operating hours + variable costs per operating hour

The fixed costs of the model machine are €54,000 per year. Variable costs are €6 for each operating hour. The plan assumes 3,600 operating hours per year.
€54,000 / 3,600 h + €6 = €15 + €6 = €21 per hour

Due to downtime, the machine actually produces for only 2,700 hours.
€54,000 / 2,700 h + €6 = €20 + €6 = €26 per hour

The actual hour is therefore €5 more expensive, which is approximately 24% more than in the calculation. The company may thus be selling below its actual costs without being able to tell from its own numbers. The number of actual operating hours is related to availability, one of the components of OEE, the indicator that evaluates overall equipment effectiveness. Availability tells you what share of the planned time the machine actually worked. The lower it is, the fewer hours the same fixed costs are spread across, and the more expensive the machine hour becomes.

➡️ Other ways to calculate operating costs

→ Cost per unit at a different production volume shows how the cost of one unit changes when you produce less or more.

Cost per unit = fixed costs / number of good units + variable cost per unit

→ Break-even point tells you how many units you need to sell for revenue to cover all costs. It is useful when deciding on a new line or order.

Break-even point in units = fixed costs / (selling price per unit − variable cost per unit)

→ Loss per hour of downtime expresses how much the company loses for every hour the line is down and the lost production can no longer be made up. It helps determine which breakdown to address first.

Loss per hour of downtime = number of units the line would produce per hour × (selling price per unit − variable cost per unit)

→ Cost of a specific order or product replaces the company-wide average. It is based on the material, machine time and labor consumed by that particular product.

Order cost = material for the order + operator hours × hourly wage + machine hours × machine hour cost

→ Cost per employee or per square meter is used when comparing operations. However, it can be misleading for differently equipped lines.

Cost per employee = operating costs for the period / number of employees
Cost per square meter = operating costs for the period / floor area of the operation in m²

Why do calculation results often not match reality on the shop floor?

⚠️ Some downtime is missing from the records

The planned number of hours is often used in the machine hour calculation, because nobody knows exactly how many hours the machine actually produced. The operator records operating time and downtime in the report only at the end of the shift, usually from memory and rounded to quarter hours. Short stops after which the line restarts on its own do not make it into the report at all. The result is a higher number of operating hours than the machine actually worked, and therefore an underestimated machine hour cost.

⚠️ Defects are recorded too late

Some defective units are not detected at the machine, but only during final inspection or after a customer complaint. They enter the records days or weeks later, often without information about the shift and the order or product they came from. The month in which they were produced then shows more good units and a lower cost per good unit than is actually the case. Moreover, without information about where they originated, it is impossible to determine whether the defects are caused by one machine, one setting or one type of material.

⚠️ Production misses the plan for no known reason

The number of units produced at the end of the shift shows that the machine did not meet the plan. However, it does not show whether it was down longer, ran slower than its specifications allow or produced units that failed inspection. Each of these losses has a different cause and requires a different measure. Without distinguishing between them, the cost per good unit cannot be reduced in a targeted way, because you do not know which loss increases it the most. In practice, the long breakdown usually gets addressed because it is the most noticeable, even though the machine may actually be losing more time by running slowly.

⚠️ Maintenance is not charged to a specific machine

Invoices for spare parts and servicing are usually charged to a cost center, which is a part of the company whose costs are tracked together, for example the entire press shop. From the accounts, you therefore know how much maintenance of the press shop cost, but not how much a specific press cost. An older machine with frequent repairs and a new trouble-free machine receive the same share in the calculation. Maintenance in the machine’s fixed costs is then an average for the entire cost center, which will not help you decide whether it is worth continuing to repair the older machine or replacing it with a new one.

⚠️ Energy is allocated only by floor area

The company measures energy only at the hall’s supply point and allocates the invoice among the lines according to the floor area they occupy. A line with a quarter of the area thus gets a quarter of the energy costs. If there is a furnace or a press on it, it may actually draw significantly more. An energy-intensive product then appears cheaper than it is, and the difference is added to the costs of other products. Moreover, the monthly invoice does not show when consumption was highest and how much energy was used during breaks and shutdowns.

⚠️ The numbers are in separate spreadsheets

Production has its own reports, maintenance its own records, energy is tracked by facility management, and material prices and wages are in the accounting system. By the time a monthly overview for management is put together from these sources, weeks go by and the overview describes a situation that no longer applies. In addition, departments often work with different numbers for the same period, so it first has to be clarified which ones are valid. When you then change something on the line, you do not have a reliable baseline from before the change to compare the result with. You therefore do not know whether the measure actually reduced costs.

How to measure and reduce operating costs?

✅ SCADA collects actual operating hours

SCADA is a supervisory system for technology that collects and displays data from machines in one place. Most of today’s machines are controlled by a PLC, an industrial control computer that knows whether the machine is running, stopped or in a fault state. On an older machine, a sensor is added. SCADA records these states without manual entry by operators, so you can enter the actual hours worked instead of planned hours into the machine hour formula. In the same way, it records the number of units produced, on which the other calculations are based.

✅ MES assigns data to orders and products

MES is a system for monitoring and managing production. To the machine data, it adds which order and which product the machine is currently producing, why it is stopped and how many units failed inspection. Some of this information is entered by the operator directly at the machine as soon as the event occurs. A defective unit is thus recorded against the correct product and in the correct month. Instead of a company-wide average, you then know how much a specific product costs. At the same time, you can see which product or machine generates the most defects and focus your measures right there.

✅ OEE monitoring distinguishes the type of loss

OEE is the overall equipment effectiveness indicator, which combines three perspectives. Availability tells you how much of the planned time the machine worked, performance how fast it produced, and quality how many units were good. Lost time is thus broken down into downtime, reduced speed and defects, and measures can focus on the largest of these losses. Fixed costs cannot be reduced quickly, but they can be spread better. Shorter downtime adds operating hours, and faster operation with fewer defects adds good units in every hour.

✅ CMMS assigns interventions to a specific machine

Maintenance interventions can be recorded in a computerized maintenance management system, abbreviated as CMMS. Each intervention and spare part is recorded against a specific piece of equipment, so maintenance in the machine’s fixed costs is based on its own history, not on the cost center average. The history also reveals machines that are repeatedly repaired for the same fault. This makes it possible to decide, based on evidence, whether to eliminate the cause, change the regular servicing interval or replace the machine. Condition monitoring can also alert you to equipment deterioration before a breakdown occurs.

✅ EMS measures consumption by line, BMS controls the building

An EMS, or energy management system, tracks consumption by machine, line and hall over time. Energy thus changes from a cost allocated by floor area to a cost measured at a specific line or even a specific machine. The load profile shows consumption during non-production hours as well as peak loads. Heating, ventilation and lighting can then be set in the BMS, the system that controls building technologies, according to when the hall is actually in use. You verify the result through consumption per good unit.

✅ Reporting and BI combine data into a single overview

When production quantities are linked with prices from the company’s ERP system, management can see them in one place. Production, maintenance and management thus work with the same numbers for the same period. The situation before and after a measure can then be seen side by side. However, Business Intelligence tools, abbreviated as BI, do not collect data on their own. They only display what they receive, so the overview is only as complete as its inputs. And measurement alone does not reduce costs either. They are only reduced by a process in which data collection is followed by analysis, action and verification of results.

How to start measuring and reducing operating costs?

  1. Choose one machine or one line and calculate its costs. Use the data you already have and note for each input whether it is measured or estimated. The result is the baseline you will compare against later.
  2. Start measuring the inputs that are currently estimates. Most often, these are actual operating hours, defects or energy consumption. If the machine does not provide them itself, add a sensor or a meter.
  3. Compare the measured data with the estimates and repeat the calculation. After a few weeks, you will see how much the actual costs differ from those you have been working with so far, and which loss increases them the most.
  4. Choose a measure for the largest measured loss and verify its result. After the change, calculate the costs in the same way at a similar production volume.
  5. Extend the approach to other equipment only once the change has proven effective. Continue when the measure on the first machine has demonstrably reduced costs and the measured data is complete.

Do you want to know where your operating costs really come from?

Can you tell today which line, shift or product increased your costs last month? If not, book a no-obligation consultation and we will look at it together. At IoT Industries, we start with one machine or line, use the equipment and systems you already have, and introduce measurement with minimal disruption to ongoing production. Before you decide on the next step, you will see in your own numbers where your costs come from and what is worth changing.

Why Choose IoT/IIoT Implementation with IoT Industries?

Traditional companies typically specialize in OT (operational technologies, such as production lines and devices) or classic enterprise IT systems. However, we are able to connect both of these worlds. Our unique expertise in integrating OT and IT allows us to deliver innovative solutions in digital transformation, enhancing efficiency, reliability, and competitiveness for manufacturing companies.
Ako znížiť náklady vo firme? Začnite tým, čo je na prvý pohľad neviditeľné. | How can you reduce costs in your business? Start with what you don’t see at first glance.

How can you reduce costs in your company? Start with what is invisible at first glance.

In the meeting, you see that production was once again more expensive than you expected. The shift supervisor talks about problems on the line, but by the time the production records are collected and the reports are prepared, another week is already underway. You may have adjusted the plan or looked for better-value suppliers, yet the same problem keeps coming back. How can you reduce costs in your company when you only get to the causes after a delay? You can start with the information that is generated in your operation every day but does not yet reach the people who can act on it in time.

Ako znížiť náklady vo firme? Začnite tým, čo je na prvý pohľad neviditeľné. | How can you reduce costs in your business? Start with what you don’t see at first glance.

Why doesn’t a cost overview show where waste occurs?

From the monthly overview, you find out that you produced fewer units, used more material or paid more for energy. The cause, however, remains hidden and with it the opportunities to reduce costs. Behind a missed plan, there may be a series of short stops that nobody remembers exactly by the end of the shift. Higher material consumption, in turn, may have been caused by an error during machine setup. And a higher energy bill may be the result of equipment running unnecessarily at times when nothing is being produced.

The information needed to uncover these causes often already exists in the company. Part of it is in the machines, part on paper and another part in a separate record-keeping system. However, if someone first has to find it and put it together, identifying the cause takes too long, and in the meantime the same error may keep repeating again and again. This is exactly where digitalization makes it possible to continuously collect, connect and make this data available where decisions about operations are made. Management and employees thus get a basis for reducing company costs before the problem gets worse.

How to reduce costs in a company using production data?

When the same data passes through several hands

An operator writes down the number of units produced on paper. Another employee transfers it into Excel and later into the company system. The same data thus passes through several people, and an error can occur with every transcription. If the numbers don’t match, someone has to find out where the mistake happened. Moreover, by the time a report is prepared from the data, the situation in production may already be completely different. The shift supervisor then has to find out retrospectively why the line is falling behind plan, instead of solving the problem when it occurred.

Digitalization makes it possible to simplify this entire process. SCADA can collect a large part of the data directly from the machines. Employees can then add further information via a simple electronic form. Once connected to the company system, the data is automatically transferred to where it is needed and displayed in clear reports. Employees therefore spend less time transcribing and checking spreadsheets. At the same time, the shift supervisor has a continuous overview of production and can respond to a problem much sooner.

Short stops that add up during a shift

Everyone notices a longer breakdown. However, production is also slowed down by smaller problems, such as a repeatedly jamming feeder, waiting for material or a full output buffer. Each time, the line starts up again and attention shifts elsewhere. At the end of the shift, however, finished units are missing and the records do not show where the production time was lost. And if the missing output is then made up with overtime, these inconspicuous downtimes also increase labor costs.

MES can be used to track downtime. It can automatically record when the line stopped, how long it was down and for what reason. Some reasons can be identified directly from the equipment status, while the operator adds others via a simple form. Management can thus determine which recurring problems cost production the most time and focus cost reduction measures specifically on them. In subsequent shifts, it can then monitor whether the intervention helped and whether downtime has actually been reduced.

Even units produced do not necessarily mean the plan has been met

A line can run for the entire shift and even produce the planned number of units. However, if some of them fail inspection, the company has to spend additional time on rework or produce replacements. This increases the cost of each conforming product. That is why, when evaluating production, it pays to combine data on downtime, speed and quality into a single whole. And this is exactly what OEE, the Overall Equipment Effectiveness indicator, is used for. It answers three questions together:

  • Availability: How much of the planned production time did the equipment actually run?
  • Performance: How fast did the equipment produce compared to the ideal rate?
  • Quality: What share of the units produced were good the first time?

However, measuring OEE on its own is not enough to reduce costs in a company. To do that, losses need to be broken down in more detail. The Six Big Losses model helps with this. For availability, it distinguishes between equipment failures and setups and adjustments. For performance, it tracks small stops and reduced speed. For quality, it separates defective units during startup from defects during stable production. For each type of loss, the team then looks for a measure that can eliminate it completely or at least reduce it. And after implementing it, the team monitors whether the loss has actually decreased.

Reactive maintenance can cost production dearly

A machine breaks down in the middle of an ongoing order. Maintenance scrambles for a spare part and service while production waits. On top of the repair cost come express shipping, an urgent call-out and the cost of catching up on the delay. This is how reactive maintenance works – the problem is only addressed once the equipment fails. In contrast, preventive maintenance aims to prevent breakdowns through regular inspections and servicing, for example after a certain number of operating hours. The company can thus prepare staff, parts and the shutdown in advance.

Predictive maintenance goes even further. Based on measured values, their trends and available history, it aims to estimate the future condition of the equipment and the time when intervention will be needed. The goal is to make full use of the service life of parts without unnecessarily early replacements, while intervening before their wear causes a breakdown. And if the data indicates that intervention is needed, maintenance can order parts in advance and agree on a suitable shutdown time with production. Timely intervention can also prevent damage to other parts of the machine and a more expensive repair.

Energy is consumed even when nothing is being produced

Production ends on Friday, but the heating and ventilation in the hall run all weekend as if it were a working day. The company thus also pays for equipment operation that does not match the actual use of the hall. However, the total invoice does not show where the unnecessary consumption occurs. Nor does the monthly meter reading show when consumption was elevated and how long it lasted. For more detailed monitoring of energy consumption, however, an EMS can be used. It makes it possible to display consumption over time and alert you to unusual consumption.

A BMS, in turn, is used to control heating, ventilation and lighting. If it turns out, for example, that equipment is running according to an old production schedule, its time program can be adjusted to the current use of the hall. At the same time, it helps maintain the conditions required for materials, technologies and people. Measurement via the EMS thus helps uncover unnecessary consumption, and adjusting the settings in the BMS can limit it. Further measurements will then show whether reducing energy costs was actually effective.

How to start with digitalization that brings cost reduction?

If you want to know how to reduce costs in your company, start with a specific problem that keeps recurring in production and costs you time or money. It may be time-consuming manual data transcription, frequent stops on one line or high energy consumption outside production hours. A clearly defined problem will then help you determine what data you need and what the solution should deliver. If there are several problems, give priority to the one that has a significant impact on production, can be addressed within a manageable scope and whose results you can verify relatively quickly.

Once the problem is defined, first check what data you already have available. You may get some of it from the machine’s control system, and more from existing meters or company systems. Elsewhere, you will need to add a sensor or a simple operator input. For existing data, also check its completeness and reliability so that decisions are not based on inaccurate records. The choice of technology, however, should only follow from what you need to find out and how you will act on the information obtained.

Test the solution first in a pilot project, meaning on one line or in a selected part of the operation. Involve the people who will use it in the preparation as well. The operator will help describe typical situations at the machine, maintenance will assess the available signals and the production manager will determine what information they need for decision-making. Also agree on who will review each alert and who will ensure corrective action. During the pilot, also verify whether operators can handle data entry during their normal work and understand the information displayed.

Before launch, define how you will evaluate the results. For administration, this may be the time spent preparing reports, for downtime the time lost waiting for material, and for energy the consumption outside production shifts. Record the baseline before implementing the solution so that you have something to compare the results with. Make sure to compare similar conditions. Once the cost reduction is confirmed in practice, you have a concrete basis for expanding the solution to other parts of the company.

Let’s find cost reduction opportunities in your operation too

Every operation has its weak spots. What matters is knowing which ones cost you the most and what needs to change so that the same losses do not repeat. This is exactly what we at IoT Industries can help you with. We will look at the problems you are dealing with, at your technologies and the data you already have available. We will propose how to use and connect them so that you can intervene in time and evaluate the results. We can start with one line or a specific problem and build the next steps on what proves effective in your production.

Book a no-obligation consultation and we will look at where to find specific cost reduction opportunities in your company.

Why Choose IoT/IIoT Implementation with IoT Industries?

Traditional companies typically specialize in OT (operational technologies, such as production lines and devices) or classic enterprise IT systems. However, we are able to connect both of these worlds. Our unique expertise in integrating OT and IT allows us to deliver innovative solutions in digital transformation, enhancing efficiency, reliability, and competitiveness for manufacturing companies.
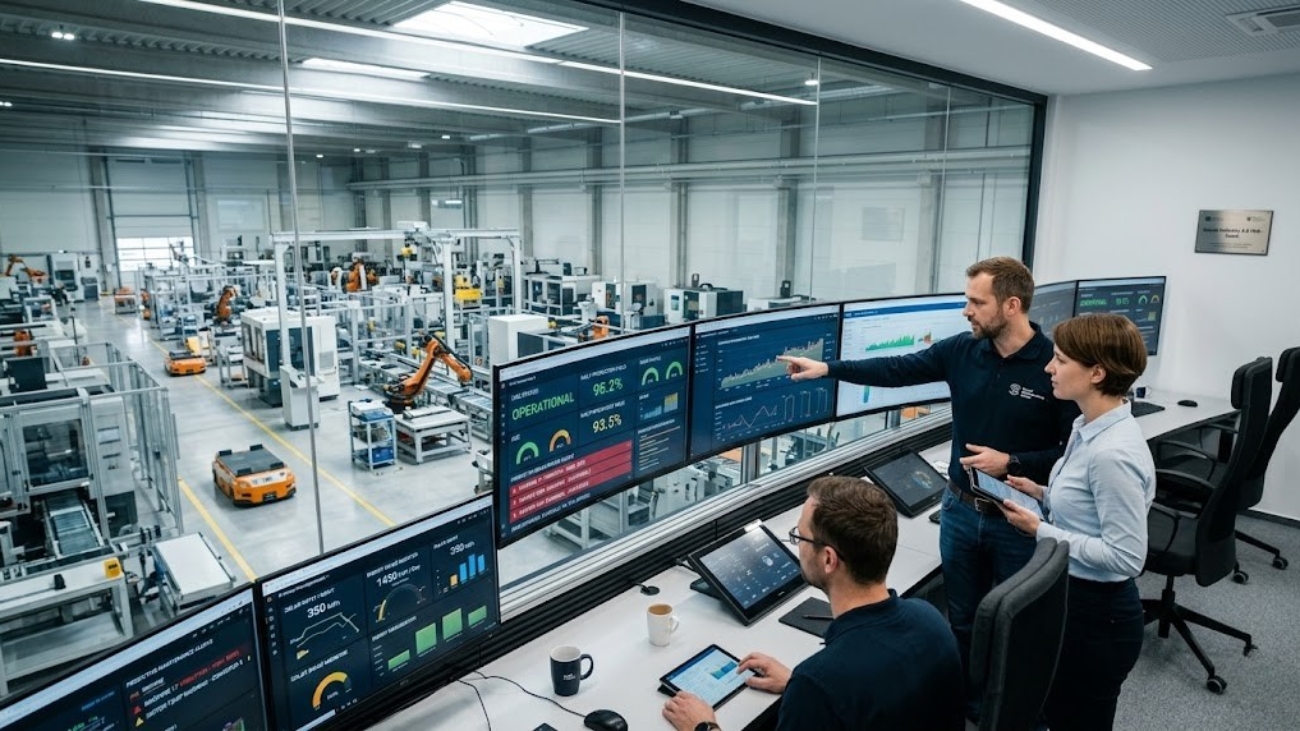
Kľúčové trendy v Industry 4.0 – Čo očakávať v roku 2026? | Key Trends in Industry 4.0 – What to Expect in 2026?

Key Trends in Industry 4.0 – What to Expect in 2026?

If you manage a manufacturing company, 2026 probably did not start very calmly for you. The pressure on efficiency is higher than ever before. Energy prices are no longer the shock they were two years ago, but geopolitical uncertainty, trade measures, and tensions in global markets are making planning increasingly difficult. At the same time, the responsibility for results still rests on you.

In such an environment, it may seem that the best strategy is to wait. To be conservative. Not to invest. However, it is precisely in times of uncertainty that it becomes clear who will maintain competitiveness and who will begin to fall behind. If you want to know which Industry 4.0 trends will bring real value in 2026 and which are just marketing noise, read on.

Kľúčové trendy v Industry 4.0 – Čo očakávať v roku 2026? | Key Trends in Industry 4.0 – What to Expect in 2026?

Why Is Tracking Industry 4.0 Trends Especially Important Today?

Companies that follow modern trends and the real possibilities of their application do not operate more efficiently because they want to appear “innovative.” They operate more efficiently because they can identify opportunities earlier where time can be saved, costs reduced, or performance increased—without immediately having to invest in new machines or expand production capacity.

An example is the use of artificial intelligence in procurement processes. Today, systems can easily contact 15 suppliers, summarize price offers, and prepare a comparison. What once took a person days can now be completed by a system within hours.

Without monitoring trends, you would arrive at such efficiency improvements five years later, most likely at a time when it has already become the market standard and you are simply catching up. And this is not some futuristic scenario. It is a practical acceleration of processes that reduces administrative burden and frees up people’s capacity for more valuable tasks.

A very similar situation can be seen in manufacturing digitalization. Companies that build a solid data foundation will be able to respond more quickly to market fluctuations, optimize capacities, and make decisions with lower risk. On the other hand, those that follow trends only passively will be implementing in a few years what their competitors are already using as a standard today.

What Challenges Will Companies Face in 2026?

1️⃣ Geopolitical Uncertainty and Difficult Predictability

The year 2026 is characterized by a high level of unpredictability. Threats of trade restrictions, sudden tariff changes, and tensions between global players can have an immediate impact on supply chains, input costs, and material availability. In a highly globalized environment, a single geopolitical decision can affect the entire market.

For many companies, success may simply mean maintaining the status quo. Not in the sense of stagnation, but in terms of stability. Maintaining margins, performance, and delivery reliability despite external shocks. And it is precisely the companies that have a clear overview of their capacities, efficiency, energy consumption, and bottlenecks that can respond to market fluctuations without panic.

2️⃣ Pressure for Flexibility and Rapid Adaptation

In the past, it was possible to plan production months in advance. Today, the situation is different. Orders fluctuate, customers change priorities, delivery times are shortening, and input prices can change practically overnight. What was true last quarter may no longer apply today. Companies therefore need to be prepared to quickly adjust production capacity, redirect production, or optimize costs.

Such flexibility, however, does not emerge from improvisation. It emerges when you have a clear overview of the real utilization of machines, where downtime occurs, and where hidden reserves exist. A company without data reacts reactively, solving problems only after they arise. A data-driven company, on the other hand, can act preventively, before the problem affects results.

3️⃣ ESG, Energy Efficiency, and Regulation

ESG is no longer just a topic for large multinational corporations. Increasingly, it also affects medium-sized manufacturing companies, either directly through legislation or indirectly through the requirements of customers and partners. If a company wants to comply with standards such as ISO 50001, it must be able to systematically monitor energy consumption at the level of individual devices, evaluate energy efficiency, implement specific measures, and demonstrate their benefits.

In 2026, however, ESG is not just a “reputational” topic. Energy represents a significant cost component. Yet many companies still cannot say exactly which machine consumes the most energy, where unnecessary peaks occur, or what the relationship is between production performance and energy consumption. Without this data, energy management is only an estimate. A company that does not have energy under control also does not have a significant part of its margin under control.

What Risks Do Companies Face If They Neglect Innovation?

A company that changes nothing today may feel stable. After all, machines are running, people are working, and orders are being fulfilled. At first glance, nothing dramatic seems to be happening. The problem is that the loss of competitiveness does not happen suddenly, but gradually. First, costs increase by a few percent. Then delivery times become longer. Later, margins decrease. Eventually, it becomes clear that competitors can produce cheaper, faster, or more flexibly.

Companies that fail to innovate systematically therefore risk:

❌ Greater risk, because in times of crisis, reserves are often what determine survival.
❌ Low ability to respond to market fluctuations, where improvisation replaces real adaptation.
❌ Higher invisible losses, as operating costs increase without companies even realizing it.

One thing is important, however: It is never too late to start. Not all innovations require major investments. Often, it is about systematic work with data, identifying hidden reserves, and gradually improving processes. And perhaps in times of an unpredictable market, focusing on efficiency improvements is wiser than waiting for “a better time.” Because a data-driven company handles uncertainty much more calmly.

Key Industry 4.0 Trends in 2026

👉 1. Automated Data Collection

Manually recording data on paper or in Excel should no longer be the norm today. Digitalization is not new, nor is it rocket science. It is the foundation of efficient management. If a company has not started yet, in 2026 it is high time to map processes, define priorities, and most importantly appoint an internal digitalization ambassador.

👉 2. OEE (Overall Equipment Effectiveness)

If digitalization is the foundation, OEE is the next logical step. The OEE indicator can reveal hidden reserves of 20–30%. And honestly, no AI will deliver such an immediate impact. However, beware of a common misconception: the fact that your machine shows OEE on its display does not mean you are digitalized. If these data remain isolated and are not connected to reporting, you are still operating “on paper.”

👉 3. Energy Efficiency Through EMS and BMS Systems

Energy management is no longer just a “nice to have.” Systems such as EMS and BMS allow companies to monitor consumption at the level of individual machines, optimize operations based on tariffs, identify inefficient equipment, and also prepare operations for ISO 50001.

👉 4. Transition from Reactive to Predictive Maintenance

Reactive maintenance (“we fix it when it breaks”) is today a costly luxury. Transitioning to predictive maintenance means collecting operational data, analyzing trends, and most importantly planning interventions before a failure occurs. Combined with a CMMS system, this creates a managed maintenance ecosystem that reduces downtime, emergency interventions, and the secondary damage associated with them.

👉 5. Unified Platforms (Ignition)

There is no need to discard existing systems. However, if a company is starting from scratch, it is wise to choose a platform that can scale. Ignition is an example of a solution that connects all critical systems, enables ETL processes, and simplifies data integration. A unified platform reduces chaos and increases the clarity of data flows.

👉 6. Digital Workforce and High Performance HMI

This topic is discussed far less than it deserves, yet its impact in practice is enormous. The ISA-101 standard defines High Performance HMI principles such as fewer colors, more context, highlighting only critical states—all designed to reduce the cognitive load on operators. A modern interface should not be about 3D graphics and blinking flames, but about the operator making fast and correct decisions.

👉 7. Cybersecurity as an Inherent Part of Projects

The question today is no longer: “Will a company become a target of an attack?” but rather: “When will it become a target?” Cybersecurity therefore must be an inherent part of every project, just as natural as occupational safety, without compromise. Not as a separate add-on, but as a fundamental architectural layer of the solution.

👉 8. Big Data and Advanced Analytics

Big Data only make sense when a company is fully digitalized, the data are reliable, and the processes work properly. At that point, connecting data with AI can bring an additional 2–3% optimization. However, as we described in the article “How Big Data Helps Reduce Costs and Boost Performance in Manufacturing Enterprises“, advanced analytics is an extension, not a replacement for fundamental digitalization.

👉 9. AI as a Tool, Not a Goal

Artificial intelligence is currently experiencing enormous hype, perhaps even greater than Big Data once did. It is clear that AI is here to stay and will have its place in industry. However, at the moment it is often overestimated and applied in situations where it does not deliver real value.

Companies should not start with the question “How do we implement AI?”, but rather “What problem do we want to solve?”. And the solution does not automatically have to be artificial intelligence. Often, automated data collection and basic process digitalization are enough. The real value lies in the correct and justified use of technology, not in the technology itself.

How to Prepare for These Trends?

If digitalization or innovation is to be successful, it cannot be random or driven only by current trends. It requires a clear structure, realistic expectations, and a process that minimizes risk while maximizing benefits. A properly designed approach also ensures that the investment will not become a one-time project, but rather a long-term tool for optimization.

A proven approach therefore looks as follows:

  • 1️⃣ Audit and process mapping
  • 2️⃣ Identification of priorities and benefits
  • 3️⃣ Solution design
  • 4️⃣ PoC (Proof of Concept)
  • 5️⃣ Implementation
  • 6️⃣ Long-term monitoring and optimization

When deciding on innovations, the greatest challenge is often to objectively evaluate one’s own processes. Internal teams are naturally immersed in daily operations, and many inefficiencies gradually become the “norm” that no one questions anymore. That is why it is beneficial to involve an external partner with practical experience, who can bring an independent perspective, reduce the risk of incorrect decisions, and accelerate the path to measurable results.

Even 2026 Cannot Stop Progress

Market uncertainty should not be a reason for stagnation. On the contrary, it is an impulse to focus on areas that increase flexibility and efficiency. Digital transformation is not a trend for show. It is a tool that enables companies to respond to unexpected situations faster than their competitors. If you want to find out where the greatest potential lies within your production, let’s start with a non-binding consultation.

“We may not know what global politics will bring. We may not know how markets will evolve. But one thing is certain. The world will not stop. Companies may decide to be more conservative, yet there is still room for innovations that deliver real value.” – Matej Medvecký, Founder & Technical Lead, IoT Industries Slovakia

Why Choose IoT/IIoT Implementation with IoT Industries?

Traditional companies typically specialize in OT (operational technologies, such as production lines and devices) or classic enterprise IT systems. However, we are able to connect both of these worlds. Our unique expertise in integrating OT and IT allows us to deliver innovative solutions in digital transformation, enhancing efficiency, reliability, and competitiveness for manufacturing companies.